
Please click here for print friendly version!
This chart looks at your company's operating leverage in conjunction with the risk profile of your investment portfolio; reflecting its net retained premiums against investments to risk assets (in relation to its surplus).
With a lower operating leverage, one may be able to consider more investment risk (for potentially higher returns) during the strategic asset allocation process.
Due to insufficient data, certain peer entities may have been excluded from this exhibit.
TThis chart compares the estimated book yield of your company’s investment-grade fixed income portfolio (i.e. US fixed income securities rated BBB, or NAIC 2, or higher).
Book Yield, is the yield locked in when a bond was purchased in the portfolio and measures expected annual income. Most insurers allocate heavily towards investment-grade bonds to meet and support policy holder obligations, reserves, etc.
Note: Data used as reported and may include additional assumptions, as necessary.
Due to insufficient data, certain peer entities may have been excluded from this exhibit.
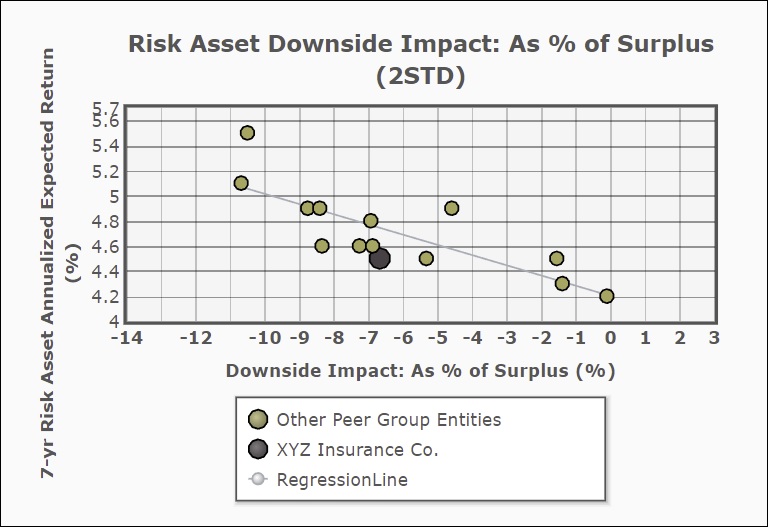
This chart reflects the expected annualized return of your company's risk asset portfolio and the potential downside impact to surplus, adjusted for deferred federal income taxes, from market movements in risk assets*. Surplus growth and declines are primarily driven by the return and volatility characteristics in risk assets.
This broadly reflects your company's risk asset appetite, implied by your asset allocation. Are you comfortable with the potential shock to your surplus given a 2-standard deviation (95th percentile) volatility event? If your surplus looks mostly unaffected by a 2 STD risk asset event, should you consider adding risk asset exposure in order to gain additional return?
Due to insufficient data, certain peer entities may have been excluded from this exhibit.
*Before Any Applicable Taxes
This chart reflects the sum of an insurance company's net written premiums ratio and its net liability ratio.
Net leverage is used to determine how exposed an insurer is to pricing and claims estimation errors.
It is used as a gauge of the insurance company's financial health. An insurer's net leverage shows how efficiently it has managed its reserves in order to address claims.
Due to insufficient data, certain peer entities may have been excluded from this exhibit.
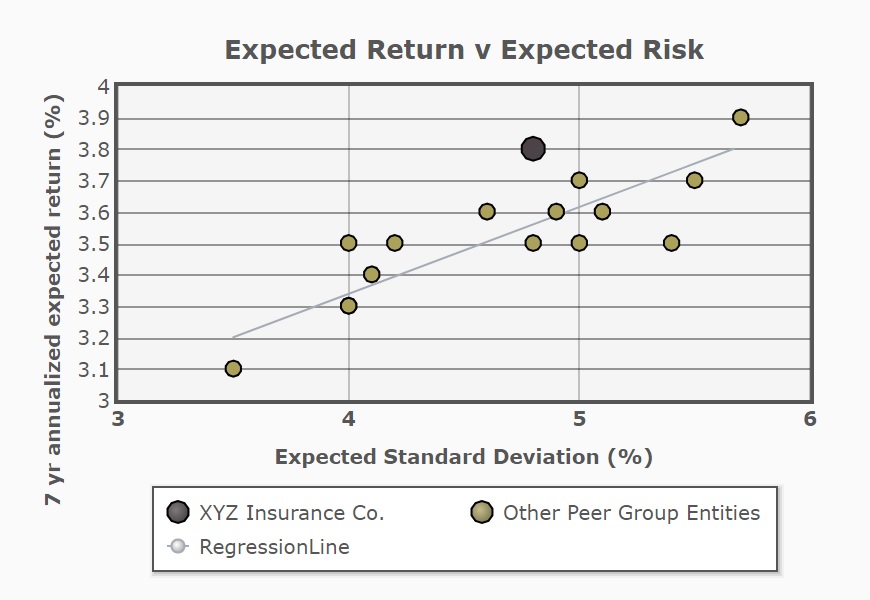
This chart broadly indicates your company's expected return to your portfolio standard deviation relative to your peers. Expected return is not a guaranteed rate of return, but rather, a forecast of the future value of the portfolio. The standard deviation reflects your portfolio's expected volatility.
Investment opportunities should always be made in conjunction with their risk characteristics. Portfolio risk can be reduced by holding combinations of assets that are diversified and less correlated.
Due to insufficient data, certain peer entities may have been excluded from this exhibit.
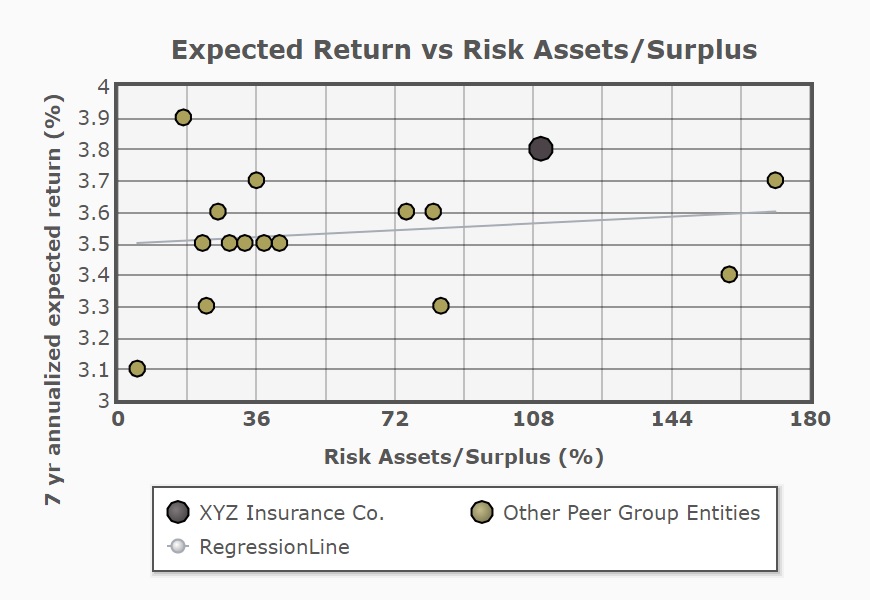
This chart indicates your company's "expected return" relative to your "risk assets". Additionally, you can compare your company's expected return to your peers.
Due to insufficient data, certain peer entities may have been excluded from this exhibit.
This chart indicates your company's fixed income exposure to BBB rated bonds relative to your peers.
Companies tend to increase BBB allocations when seeking greater investment income or future returns.
This chart displays what your company's average maturity is for each credit rating bucket relative to your peers within your corporate bond allocation.
This is a measurement in years for how long it takes for the price of a bond to be repaid by its internal cash flows (coupons and principal repayment at maturity). Bonds with higher maturities carry more interest rate risk and have higher price volatility. Combining more interest rate risk with a lower credit profile could also be a concern.
This chart indicates your company's allocation to corporate bonds broken down by credit rating category relative to your peers.
Corporate bonds are typically higher risk than government bonds which typically leads to higher yields. The lower an issuer's credit quality, the more costly it becomes to issue debt due to its increased chances of default.
This chart indicates your company's allocation to NAIC rated bonds 3 to 6 relative to your peers.
High Yield bonds carry a higher risk of default; however, these bonds pay a higher yield than investment grade bonds.
This chart indicates your company's common stock allocation relative to your peers.
Common stocks typically offer greater returns than bonds but carry higher risk of loss as well as increased return volatility. If your portfolio holds a large percentage of surplus in common stocks and stocks suffer significant losses (e.g. 2008), your surplus position could be materially impacted.
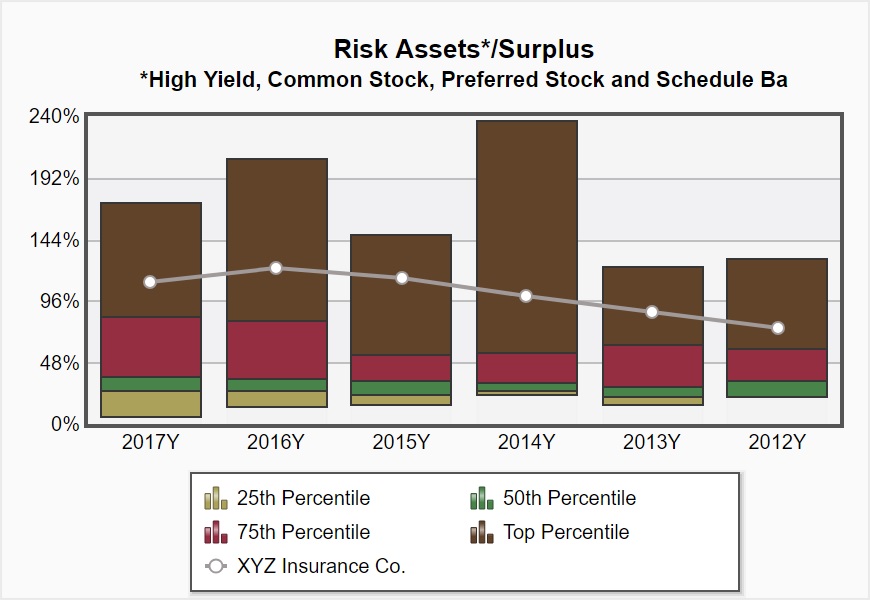
This chart broadly indicates your company"s allocation to "risk assets" relative to your peers. Risk assets typically consist of High Yield bonds, Common Stock, Preferred Stock, and long-term Schedule Ba investments which may include a number of other asset classes (real estate, hedge funds etc.).
Since returns are not guaranteed, an increase in your risk asset bucket over time should be yielding you an appropriate increase in return. If your company is in a lower quartile, it is important to consider if any added benefits could be gained from your portfolio adjusted for risk.
This ratio measures a company's net retained premium in relation to its surplus. This ratio measures the company's exposure to pricing errors in its current book of business. A company should demonstrate a controlled business growth with quality surplus growth from strong internal capital generation. It is also important to look at your company's operating leverage in conjunction with the risk profile of your investment portfolio. With lower operating leverage, one may be able to take on more investment risk.
This chart indicates the total liabilities to surplus relative to your company's peers. This measures a company's exposure to unpaid obligations, unearned premiums, and exposure to reserving errors.
This exhibit represents the average annual fee of core fixed income managed assets per entity.
How does your average annual fee compare? A fee level does not determine a manager’s effective capabilities, however, there has been increased downward pressure on manager fees across the industry.
This exhibit shows Risk Assets divided by Surplus (Surplus = "net position" or "net assets").
It broadly indicates your company's allocation to "risk assets" relative to your peers. Risk assets include high yield bonds, bank loans, real estate, common stock, preferred stock, and equity funds. An increase in your risk allocation should be yielding an appropriate increase in return. If your company is depicted as relatively lower, it is important to consider if any added benefits could be gained from your portfolio adjusted for risk. For pools that are restricted from holding risk assets, additional options may include forming a captive pursuant to applicable laws.
This exhibit shows Invested Assets divided by Surplus.
This metric exhibits the investment leverage across each entity. Investment risk is only one component of an entity's overall risk profile, and should be considered alongside operational risk, underwriting risk, and reinsurance/reserving risk. How much surplus does your pool need to meet its members' needs, to manage the risk exposures it's comfortable taking, and to maintain a cushion for contingencies?
This exhibit shows Net Premiums divided by Surplus.
This ratio measures the exposure to pricing errors in the company's current book of business. A company should demonstrate a controlled business growth with quality surplus growth from strong internal capital generation. It is also important to look at your company's operating leverage in conjunction with the risk profile of your investment portfolio. With lower operating leverage, one may be able to take on more investment risk.
This exhibit shows Total Liabilities divided by Surplus.
This ratio measures company exposure to unpaid obligations, unearned premiums, and exposure to reserving errors.
Table of Contents
About InsurerCIO
InsurerCIO, provided by Strategic Asset Alliance, supports each component of the entire investment process for insurance companies and government risk pools. This includes their portfolio monitoring and performance measurement process.
Beyond monitoring what your manager(s) has been doing and simply looking at the rate of return, it is important to track how the portfolio is acting in accordance with your organization's structure, objectives, and goals.
InsurerCIO's Portfolio Analytics provides insight into:
- Compliance Monitoring
- Stress & Sensitivity Testing
- Credit Position and/or Future Risk to OTTI
- Performance Adjusted for Risk, Fees and Taxes (if applicable)
- Trends Over Short and Long-Term Periods
- How Have Peers Structured Their Portfolios? How Do We Compare?
InsurerCIO's Portfolio Analytics:
InsurerCIO's proprietary reporting platform generates in-depth reports and analyses, ranging from asset allocation to OTTI, to correctly review your portfolio and measure performance.
Aside from reviewing the level of return, your organization should analyze “why” the portfolio performed the way it did and adjust performance to the level of risks being taken. InsurerCIO's reporting platform assists with this process.
Access to InsurerCIO is provided to all SAA clients. If you'd like to utilize the InsurerCIO analytical platform, please contact us to request a demo
InsurerCIO will address:
- How you should be reviewing and analyzing your portfolio.
- Discover important questions to ask your investment manager.
- How your portfolio is actually performing.
- How your portfolio compares to similar insurers.
- Maintaining proper corporate governance.
- Quarterly reviews of your investment portfolio.
Portfolio Analysis & Review:
InsurerCIO will help your insurer understand the 'whys?' behind performance and review your portfolio from the perspective of required income, benchmark, risk adjusted, after tax and after fee returns. Some of these key insights include:
What It Shows:
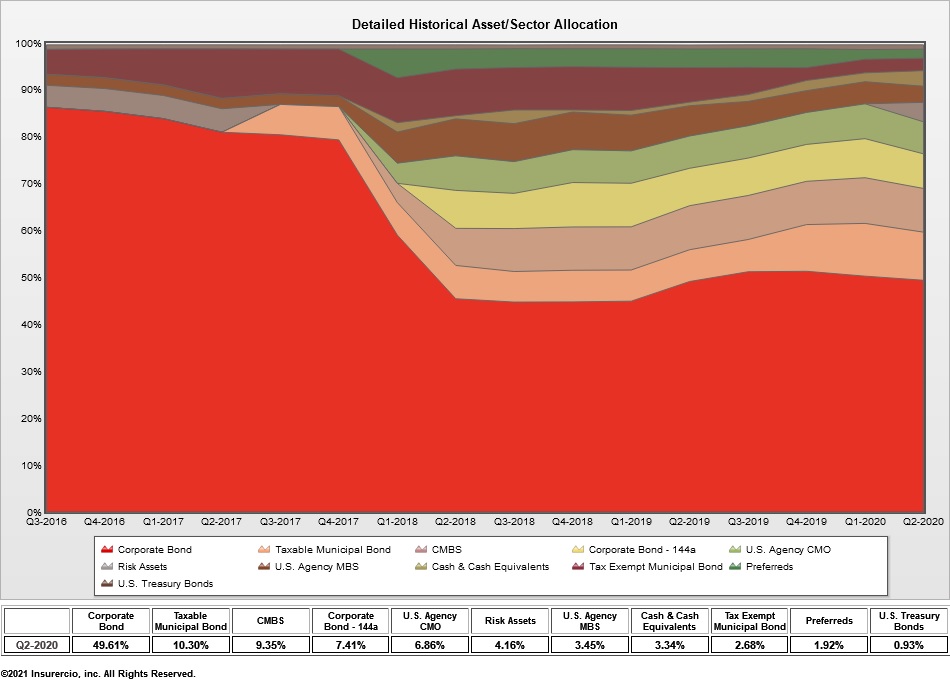
Fixed income portfolio asset allocation by sector over the last six years. This chart can be viewed in either a detailed or summarized version.
Significance:
Insurers tend to make changes to their portfolio slowly from quarter to quarter, keeping in mind realized gain or loss limits, etc. However this report allows you to see trends over a longer term horizon, since small changes over a long period of time can equate to very large changes.
What It Shows:
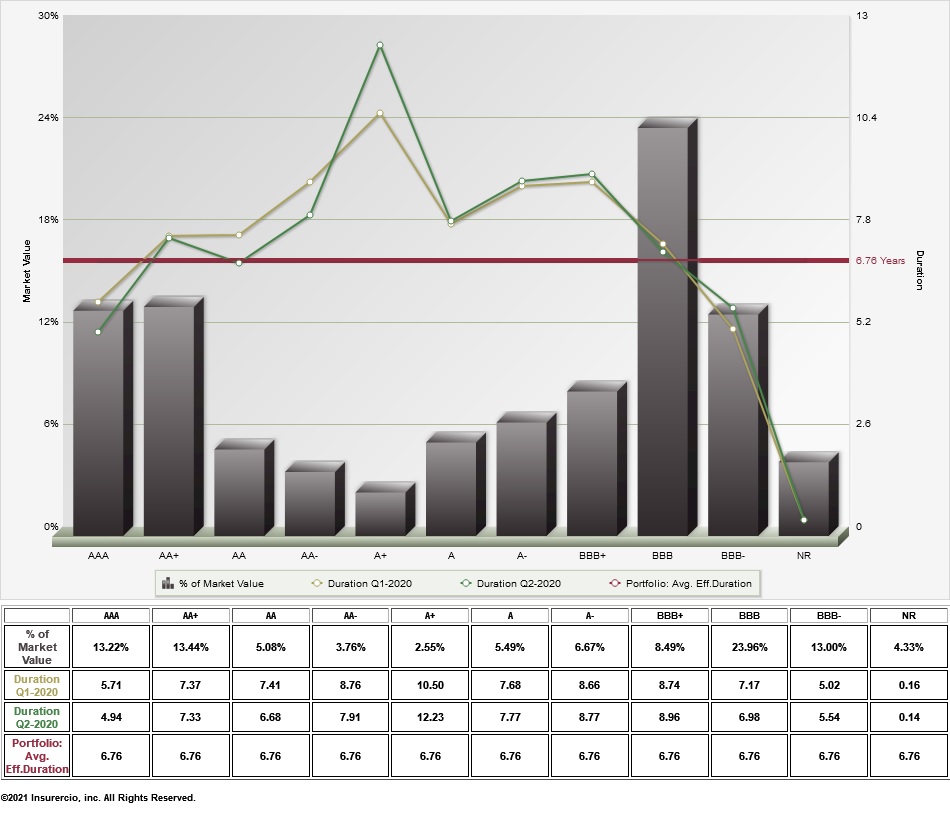
Did you know that the credit rating agencies provide the same rating for a given issuer, irrespective of the maturity of its bond? With that in mind, this graph combines credit and interest rate risk.
Significance:
Combining credit and interest rate risk simultaneously can be problematical. If duration increases as credit risk increases (an upward sloping line) the portfolio is indeed combining credit and interest rate risk simultaneously.
What It Shows:
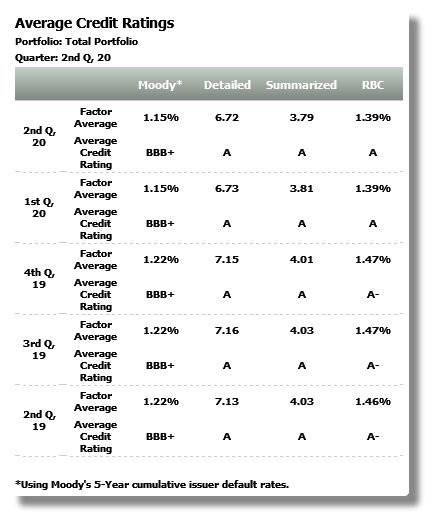
Using long term Moody’s default factors we find that the default probability increases in much greater than a linear way. By re-weighting each bond’s probability of default using those factors and then determining the average credit quality, we get a better idea of the portfolio’s “true” average credit rating.
Significance:
We believe it is important to correctly calculate such ‘minimum’ average credit rating and/or at least be aware of the difficulties in accepting the linear approach found in nearly all investment reporting systems.
What It Shows:
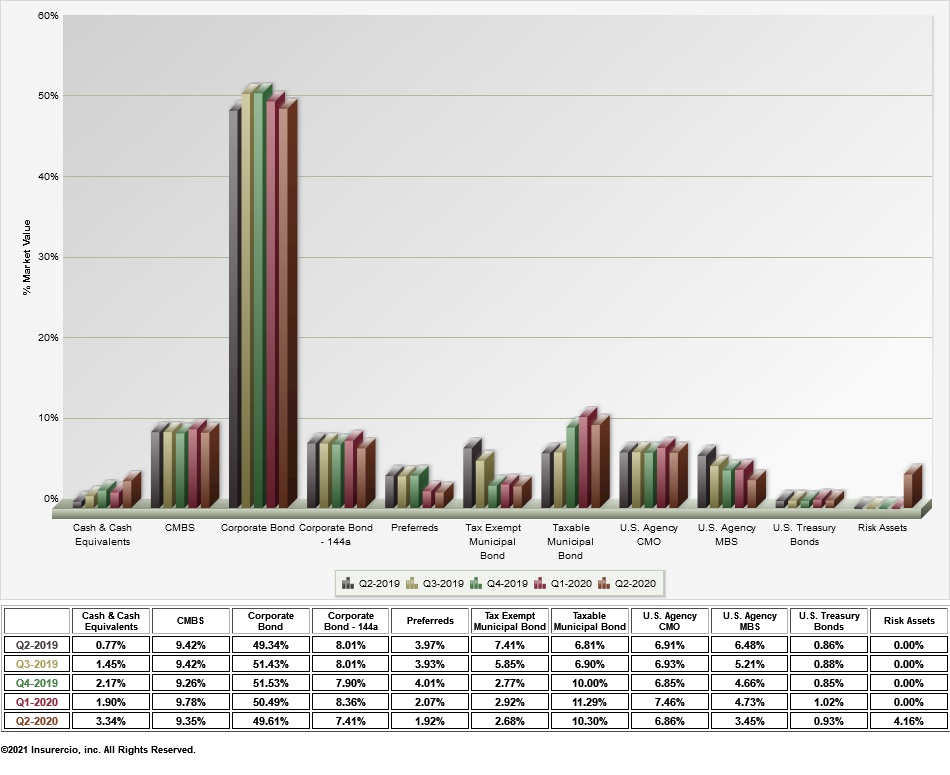
Fixed income portfolio asset allocation over the last five quarters.
Significance:
Behind every fixed income portfolio is an allocation amongst similar, yet different, asset classes. Insurers tend to have portfolios tilted more towards 'spread' sectors and away from lower yielding US Treasuries and Agencies. This report allows you to see trends in the mix of sectors over the last five
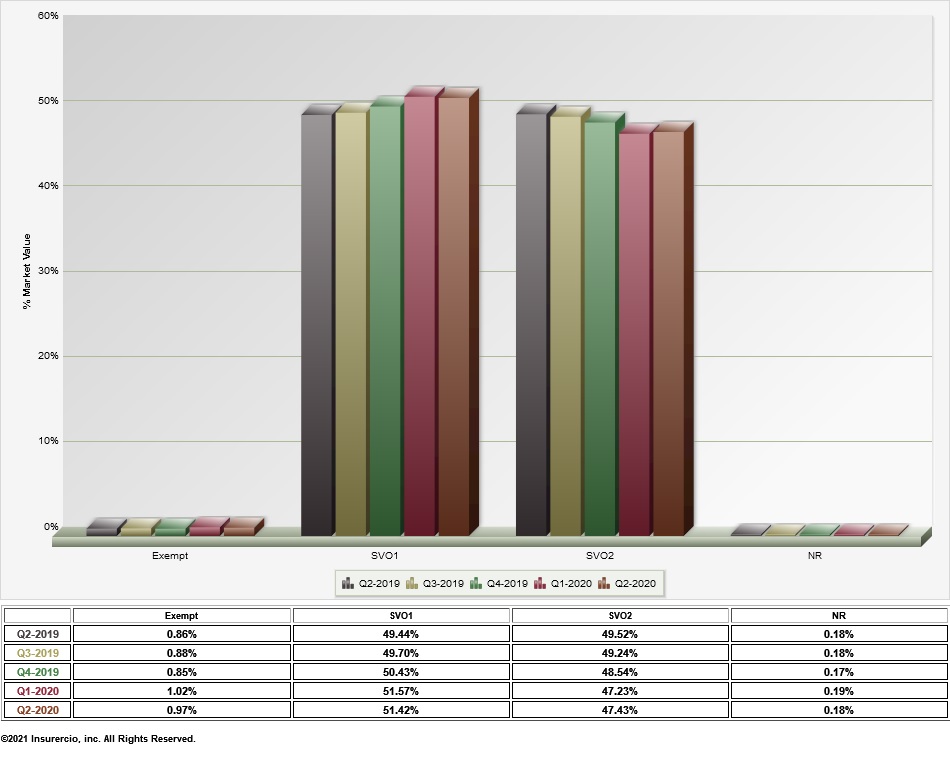
What It Shows:
The Securities Valuation Office (SVO) of the National Association of Insurance Commissioners (NAIC) requires that US insurer fixed income investments have an SVO credit rating, ranging from 1 to 6. This report uses that table to imply the correct SVO rating for each security in the fixed income portfolio; and then show the percentage of the fixed income portfolio invested in any given SVO rating over the last five quarters.
Significance:
This report allows you to see trends in this allocation over the last five quarters, as would be seen through the ‘eyes’ of the SVO.
What It Shows:
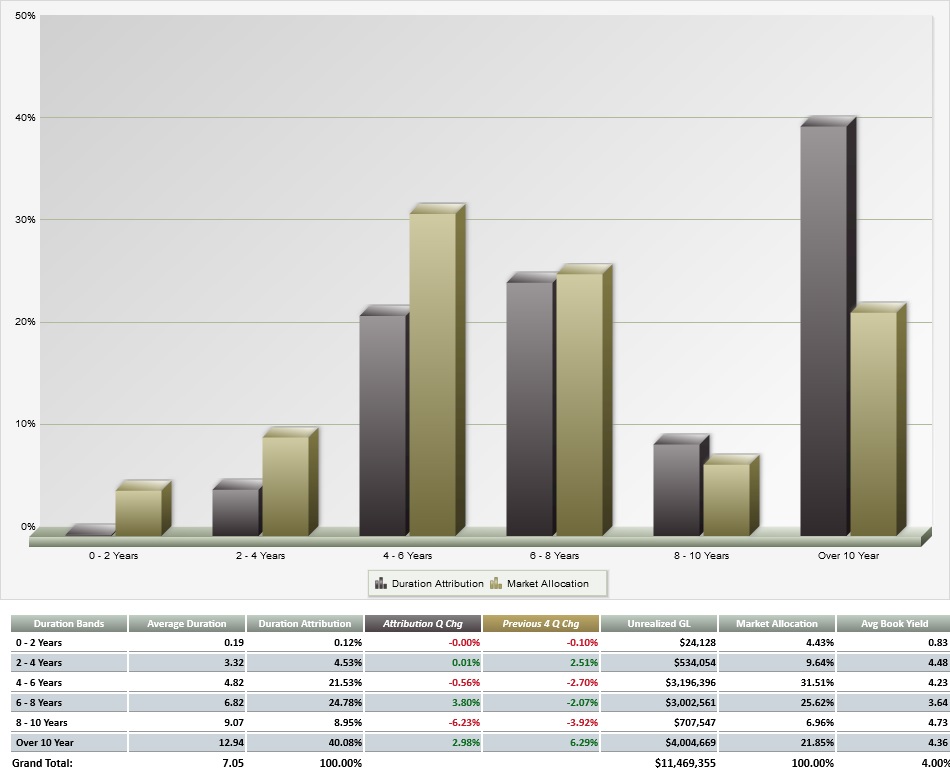
Duration Profile shows places the bonds in the portfolio into six pre-determined duration buckets. Duration Attribution is calculated by multiplying the average duration in a given bucket by the market value (market allocation) and then dividing that result by the multiplication of the portfolio’s market value by its average duration.
Significance:
We know the portfolio’s average duration, but how are the bonds that make up that duration determining how we get that average duration? Knowing where duration is occurring can provide a better understanding on how sensitive the portfolio may be to changes in the shape of the yield curve.
What It Shows:
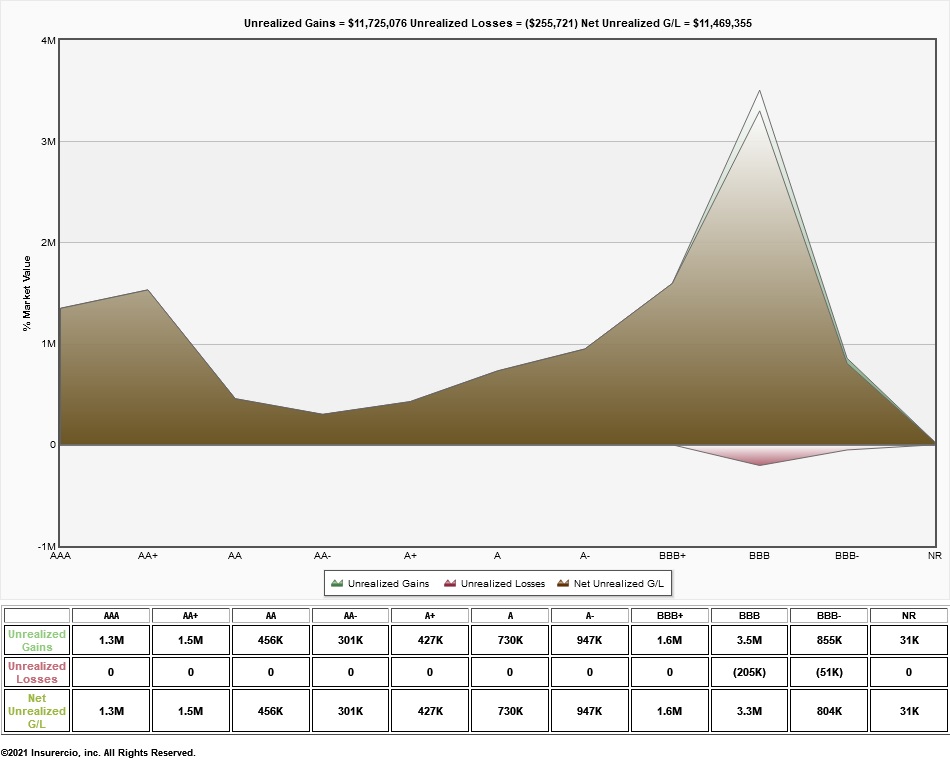
What are gross unrealized gains and losses, as well as net gains or losses for bonds in various credit rating categories.
Significance:
If gains or losses are unusually large for a given credit rating, it may be worthwhile to determine the source of such gains or losses.
What It Shows:
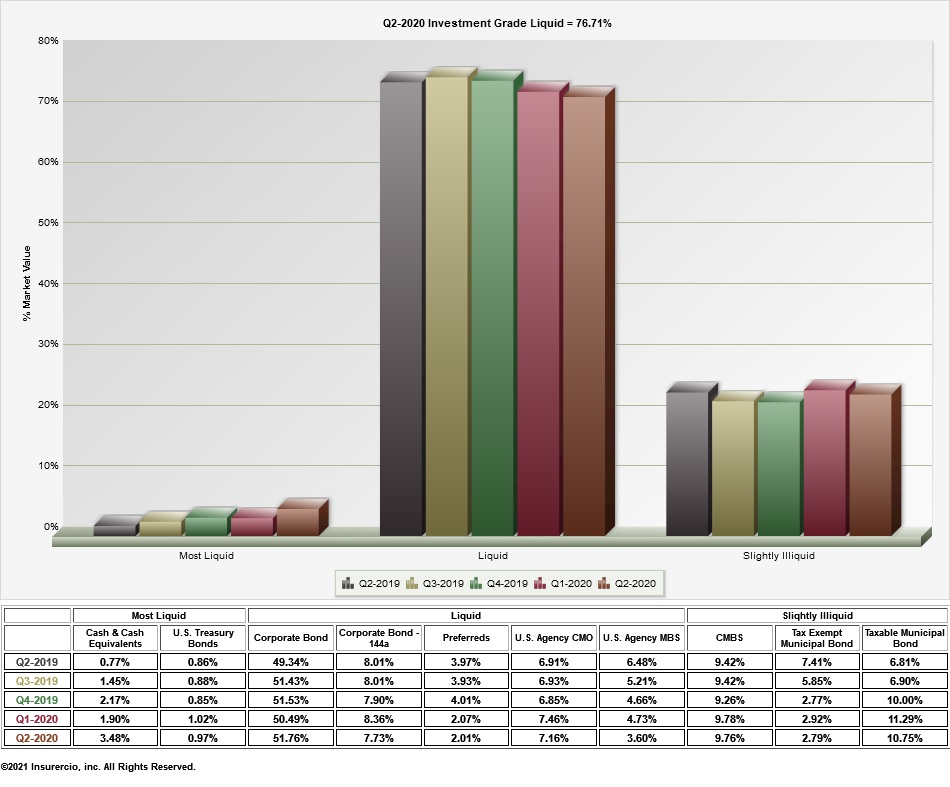
This graph arbitrarily places certain asset classes in three basic liquidity buckets: Most Liquid, Liquid and Slightly Liquid. It compares this approach over the five most recent quarters.
Significance:
This approach attempts to raise the issue and be a starting point for discussions, especially as there are major changes over time or if the portfolio appears to be too liquid or not liquid enough based upon this very initial view.
What It Shows:
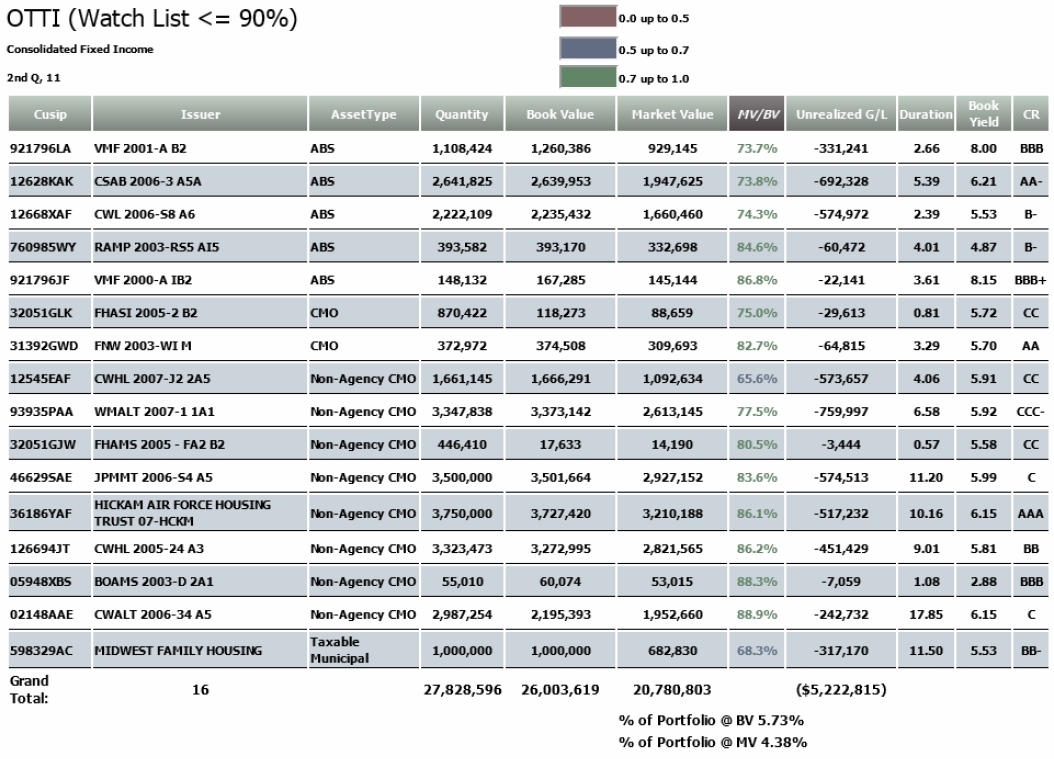
Other than temporary impairment (OTTI) usually occurs when a security’s fair market value is below 80% of book value for a consecutive six months or more. However, this report screens for securities below 90% of book value, color coding the amount of book to market value percentage depending upon how serious the value drop is.
Significance:
This report serves as an 'early warning' for such securities, as it screens for securities that are valued below 90% of book, showing key statistics including book value, unrealized loss, duration, book yield and credit rating.
Questions for your Investment Manager:
These are just a few of the important questions you should be asking your investment manager(s) as you discuss your investment process, using InsurerCIO's reports as a starting point for discussions.
Additionally, a key issue of good corporate governance is the monitoring of investment manager performance by an independent third party. Many investment managers have high investment flexibility that provides an opportunity for improved investment income and return, but also increased risk. These questions will help keep your manager focused on your insurer's investment goals.
How Would Your Manager Answer These Questions?:
- Are you combining credit and interest rate risk within a given credit rating?
- Do you think we're being compensated for the portfolio credit risk we are taking?
- Why did our book yield trend in the manner shown on the graph?
- Why did a given asset class increase or decrease over time?
- Why did a given credit rating category increase?
Measuring Performance:
Determine why the manager is or is not beating the benchmark. What is more important is understanding how the manager is achieving your company’s goals. SAA utilizes InsurerCIO to help you stay focused on the three most important factors: Performance, performance and performance.
Where Does Your Insurer Fall on this Objective Continuum and Why?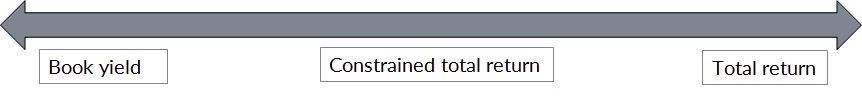
What This Shows About Your Portfolio:
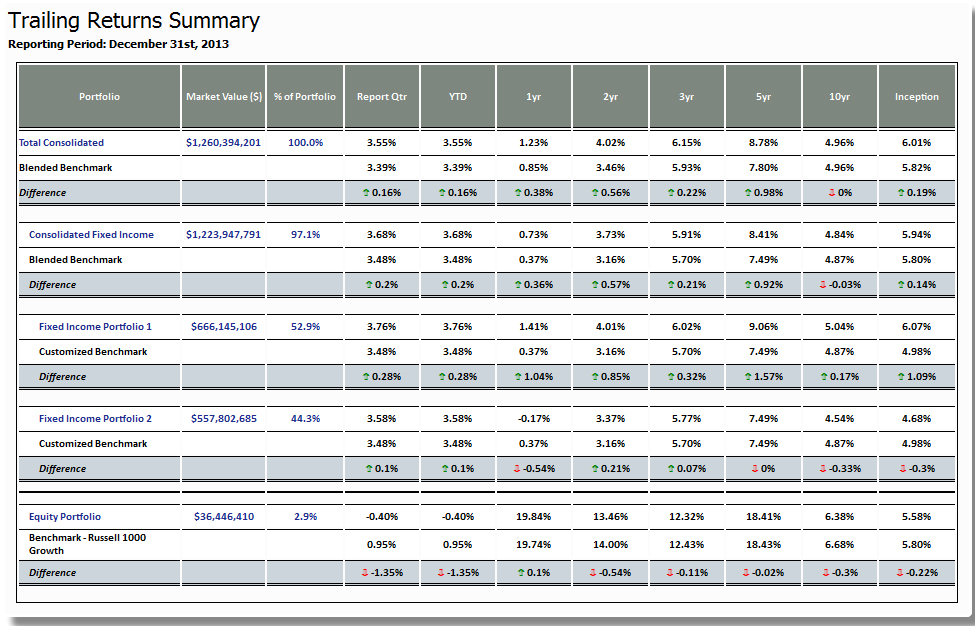
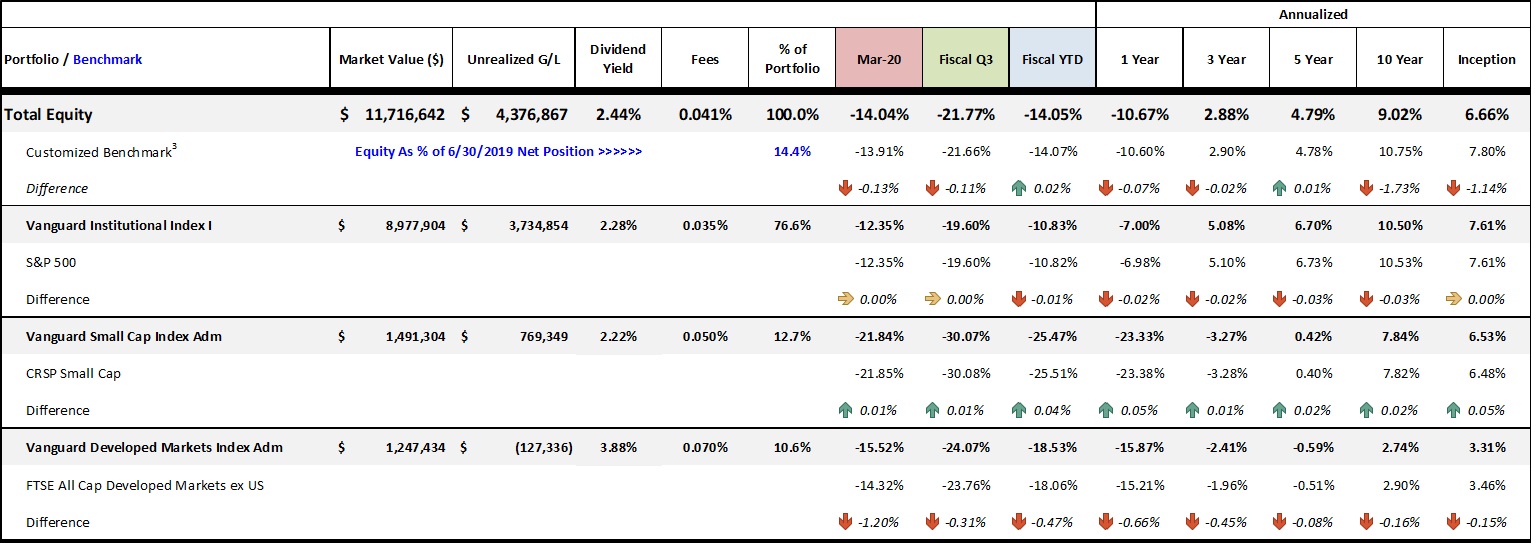
The table shows performance against the relevant benchmark for various fixed income portfolios and equity portfolios. Fixed income portfolios, in the example, are also shown combined. Then, the fixed income and equity portfolios, performances are combined for a 'Total Consolidated' viewpoint. We also use red and green arrows to note over/under performance. Since over or under performance in a relatively small portfolio may not greatly impact the overall portfolio, we show the ending market value for each fixed and equity portfolio, as well as the percentage invested in each.
What This Shows About Your Portfolio:
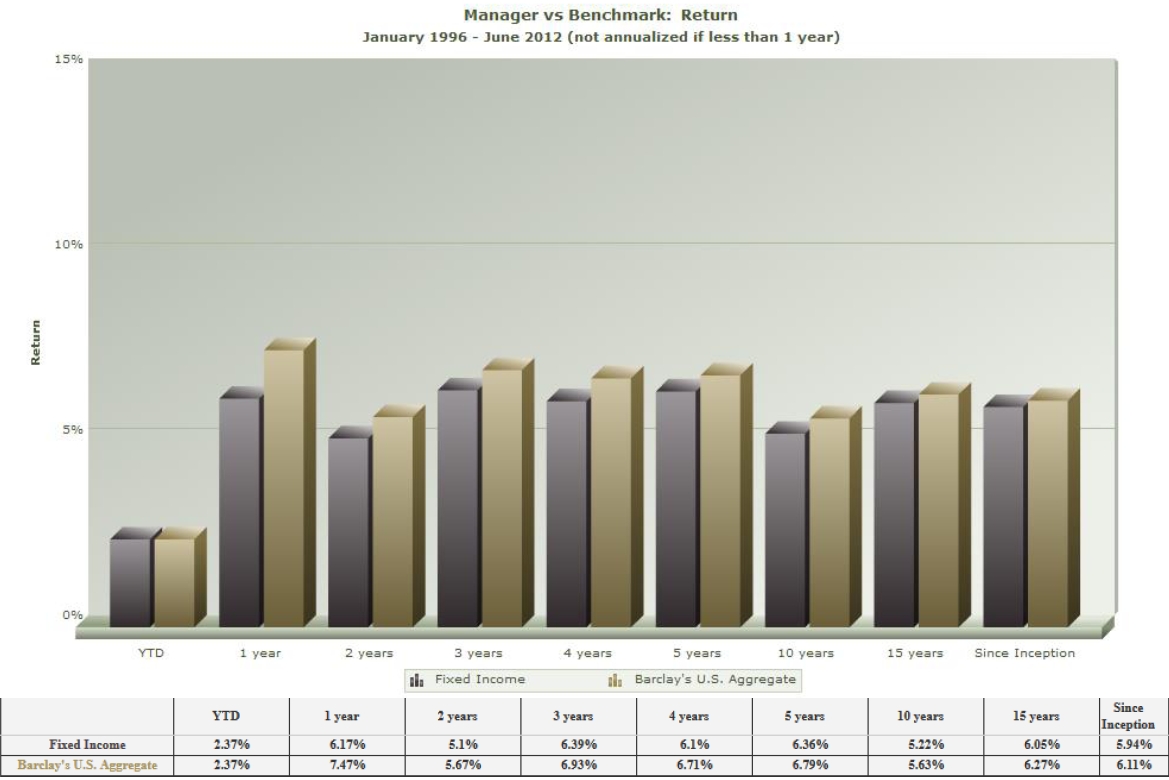
This graph compares portfolio performance to its benchmark over several different time periods. Please keep in mind that an unusual over or under performance in a given year can severely skew these results. Also, please remember that this does not answer the question of whether the correct benchmark is being used. Since, over the long run, 95%+ of investment grade bond portfolio returns are yield related, it will be important to have a carefully constructed custom benchmark that is more yield focused than a generic index like the Barclay’s US Aggregate (which has about 2/3 in lower yielding US Treasuries). This will set a higher hurdle for manager performance.
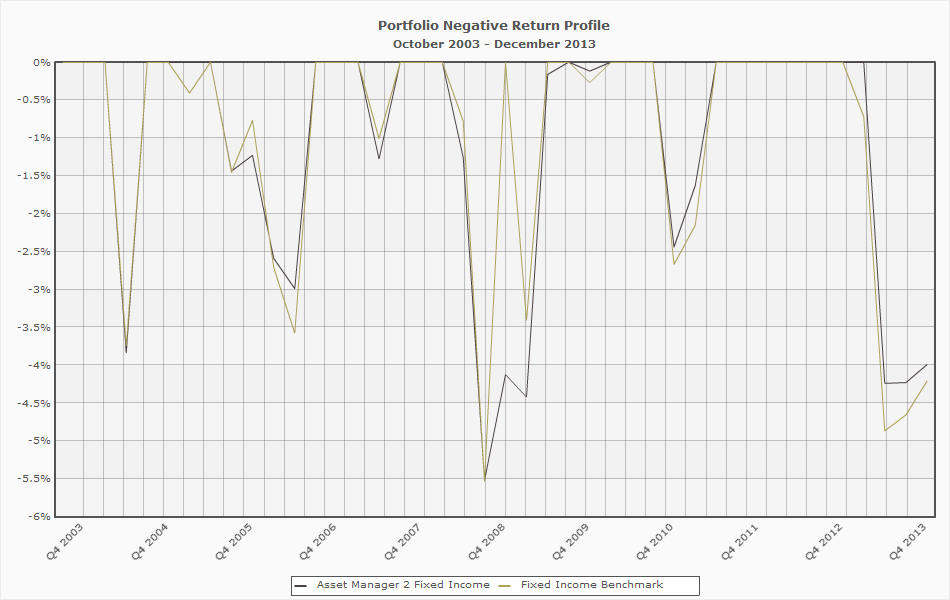
What This Shows About Your Portfolio:
How bad did the portfolio’s value get as compared to its benchmark? Drawdown starts to appear on this graph once value turns downward. It stays down until portfolio value recovers, but starts again once the value turns down. These 'icicles' show how deep the drawdown was and for how long (width of the 'icicle') as well as when they occurred. Although this graph is for the fixed income portfolio, this can also be applied to other portfolios, including equities, where value changes make drawdown even more important to view.
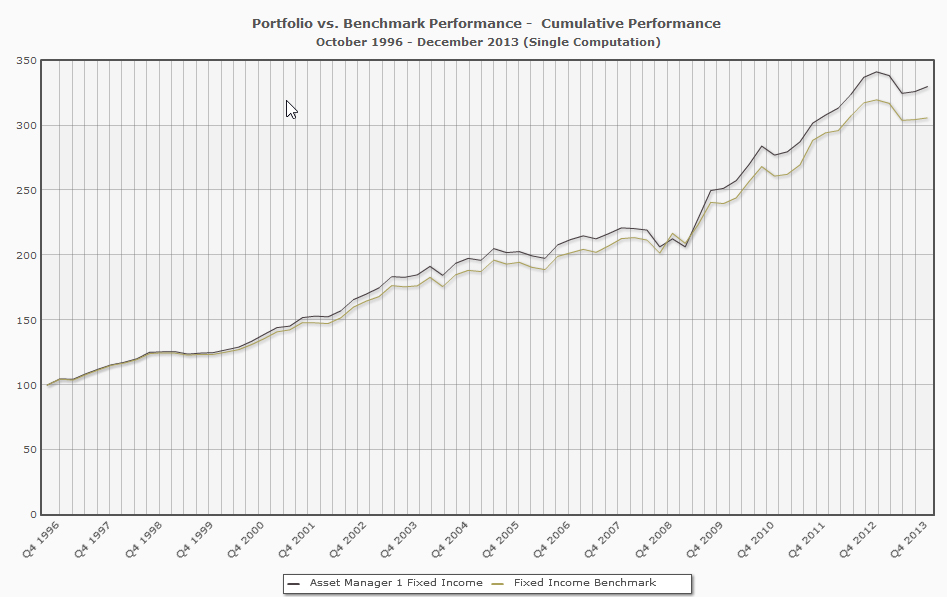
What This Shows About Your Portfolio:
This is the traditional 'value of one dollar' invested in the portfolio (or benchmark) graph. Instead of one dollar it starts at a value of 100 and shows cumulative over/under performance at various points in time.
Peer Group Analysis:
InsurerCIO provides a Peer Group Analysis looking at the risk profile, portfolio composition, and use of surplus in comparison with selected peer companies.
Peer companies are selected based upon them having similar sized portfolios and writing similar lines of business as defined by their annual statements. At your request, we will also perform similar analysis using data from other companies selected by you.
This Peer Group Analysis is provided to all Members, and utilized by Strategic Asset Alliance in creating peer analyses for their clients.
The Peer Analysis will address and includes:
- How have peers structured their investment portfolios?
- How do peers compare to what we have done?
- Are they using strategies, tactics or ideas we should consider?
- How does their investment structure mesh with their business.
What This Shows About Your Portfolio:
This chart broadly indicates your company's expected return to your portfolio standard deviation relative to your peers. Expected return is not a guaranteed rate of return, but rather, a forecast of the future value of the portfolio. The standard deviation reflects your portfolio's expected volatility.
Investment opportunities should always be made in conjunction with their risk characteristics. Portfolio risk can be reduced by holding combinations of assets that are diversified and less correlated.
What This Shows About Your Portfolio:
This chart indicates your company's "expected return" relative to your "risk assets". Additionally, you can compare your company's expected return to your peers.
What This Shows About Your Portfolio:
This chart broadly indicates your company"s allocation to "risk assets" relative to your peers. Risk assets typically consist of High Yield bonds, Common Stock, Preferred Stock, and long-term Schedule Ba investments which may include a number of other asset classes (i.e. real estate, hedge funds etc.).
Since returns are not guaranteed, an increase in your risk asset bucket over time should be yielding you an appropriate increase in return. If your company is in a lower quartile, it is important to consider if any added benefits could be gained from your portfolio adjusted for risk.
Fixed Income Portfolio Size (millions)
Applied Criteria
Search Criteria
What is Manager Select and what can you do with it?...
- An online investment manager search tool for insurance companies containing submitted questionnaire data from asset management firms, totaling unaffiliated insurance fixed income accounts and trillion in unaffiliated fixed income assets. These questionnaires are developed & distributed by SAA and customized to reflect the needs of insurer investment portfolios.
- Find a detailed overview of each manager, including their investment process and performance.
- Automatically run extensive comparisons of up to 5 managers, measuring descriptive attributes and Core & Intermediate Performance.
- Filter the displayed managers by selecting items in the search criteria drop-downs. The list of managers will automatically adjust each time a search criteria is selected. If multiple criteria are selected the list will be filtered to mangers containing all of the criteria
- The managers drop-down can be used to indidually add mangers to a list that has already been filtered.
- Selecting an item in the performance drop-down will result in a list sorted by the selected performance criteria.
- Performance Interrogatories are retrieved from the PSN database or provided by the associated investment management firm.
Search Results
Tip - Select up to 5 managers for comparison
Manager Select: FAQ
How to Utilize Each Feature of the Database
Beginning / Customizing Your Search:
- Generate an Initial List of Managers
- View All Managers
- Filter List / Adding Search Criteria
Generate an Initial List of Managers
1. To begin a search within Manager Select, enter the desired fixed income portfolio size ($millions) in the field found at the bottom of the introductory page.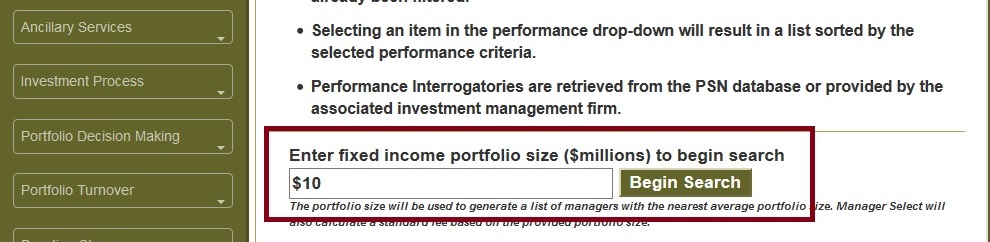
2. After entering the desired portfolio size, a list of managers with an "average client portfolio size" nearest to the number entered will be generated. Manager Select will also calculate a standard fee based on the provided portfolio size.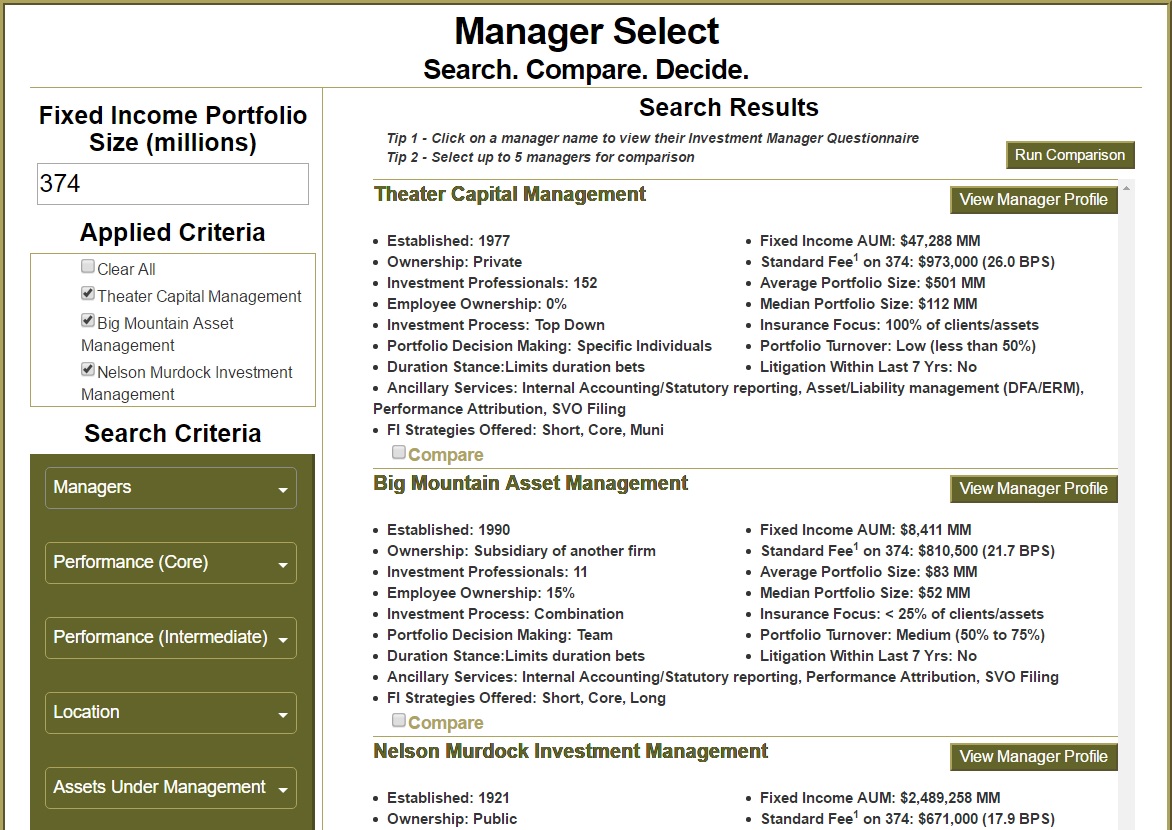
3. From here, you can begin selecting the "Search Criteria" listed on the left to begin customizing your own list of managers.
View All Managers
There are two ways to view all managers within the database:
1. You can click the "Show All Managers" button found at the very top of the platform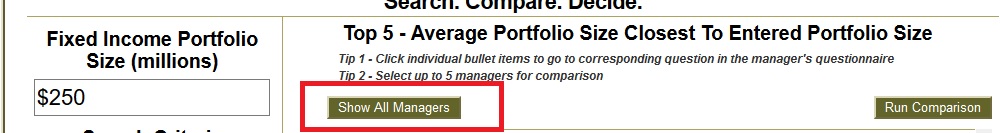
2. If you've already applied search criteria, click the checkbox near "Clear All."![]()
Filter List / Adding Search Criteria
1. After starting an initial search, you can immediately generate your own list of managers based on selected search criteria found on the left-hand side.
Please Note: selecting a "Search Criteria," after generating the initial list of managers by average client size, will begin a new search.
2. When Selecting "Performance," only one performance criteria (core or intermediate) can be selected at a time. If a second performance criteria is chosen, when another is already selected, the previously selected criteria will be removed.
When a "Performance" criteria is selected, the generated list will be sorted by the corresponding performance criteria (from highest to lowest). If no performance criteria is selected, the list will be sorted in alphabetical order.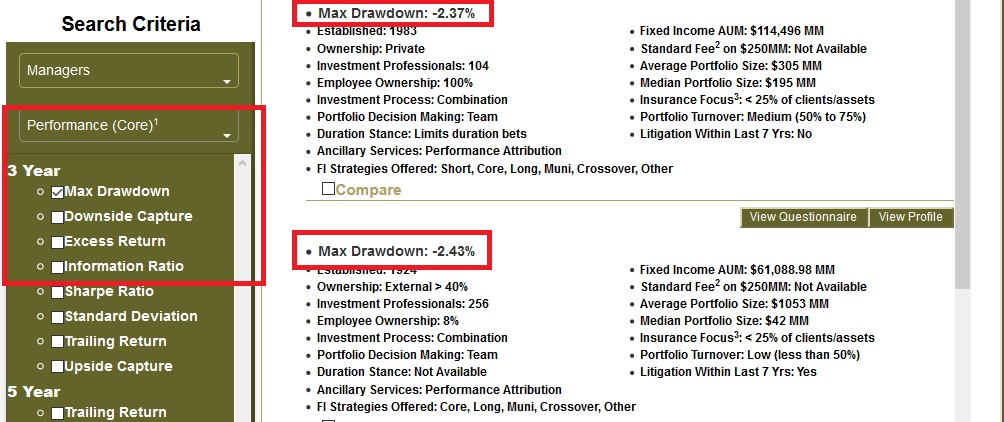
3. If you would like to include certain firms in your search, ensure you select the desired firms from the drop-down titled, "Managers," before selecting any other search criteria. These firms will be included in the generated list, regardless of other selected search criteria.
Please Note: If a manager is selected after you've already selected your desired search criteria, the search will reset and all other search criteria will be removed.
4. When Selecting Any Other Search Criteria, firms that do not meet the selected criteria will be removed from the list. As many search criteria as desired can be applied to the customized search.
To start your search over or view the full list of managers, click "Clear All" under the "Applied Criteria" section.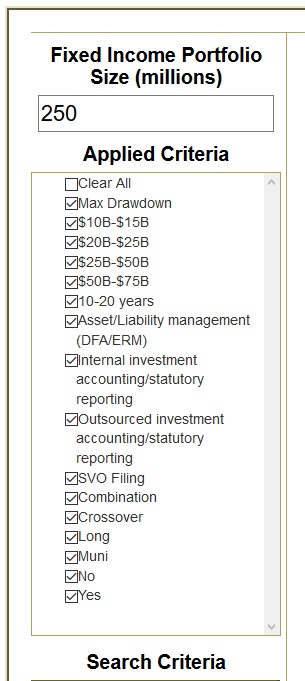
5. To Reset Your Search, or view the full list of managers, click "Clear All" under the "Applied Criteria" section.![]()
View Summary Profile
1. For a summary overview for a specific manager, simply click "View Profile," on the right-hand corner.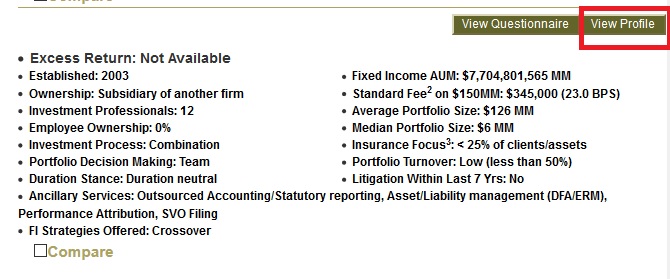
2. After navigating to the "Manager Profile," you can view the complete response by clicking on the header of a specific field and navigate to the section of the questionnaire that it corresponds with.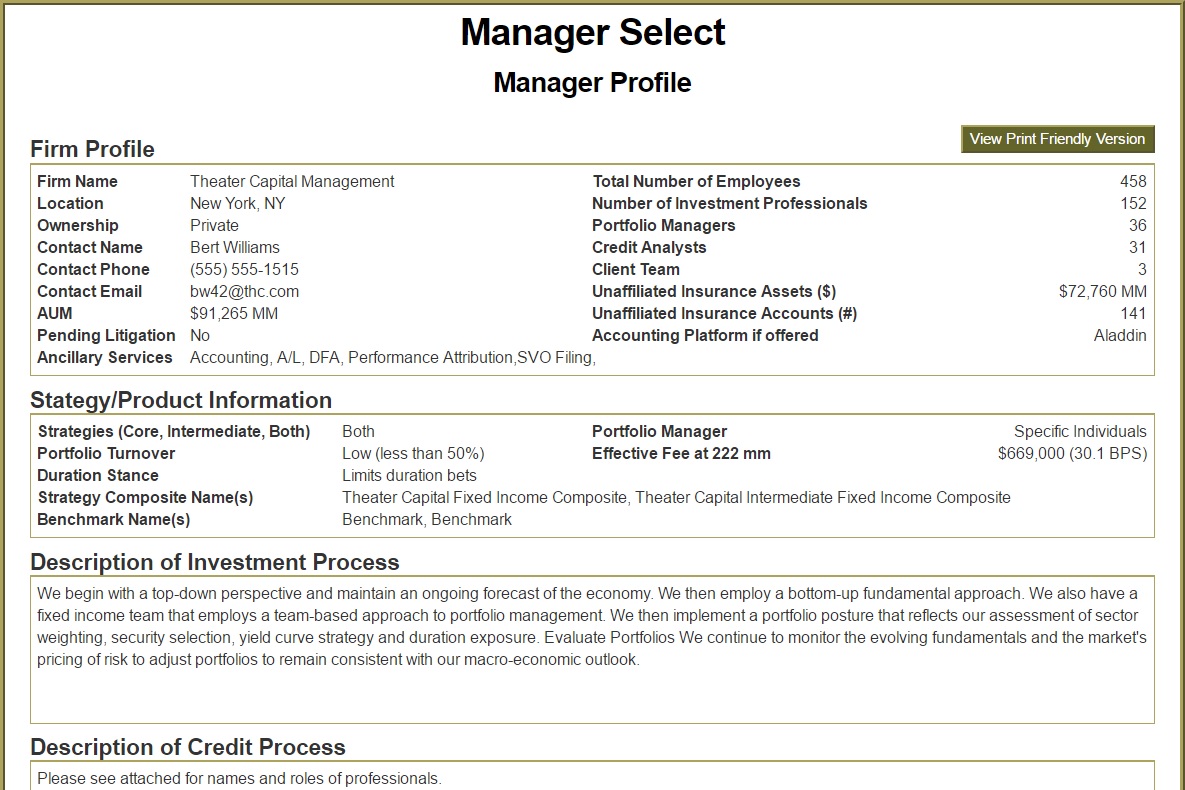
View Full Questionnaire
1. To view a manager's complete questionnaire, simply click "View Questionnaire," on the right-hand corner.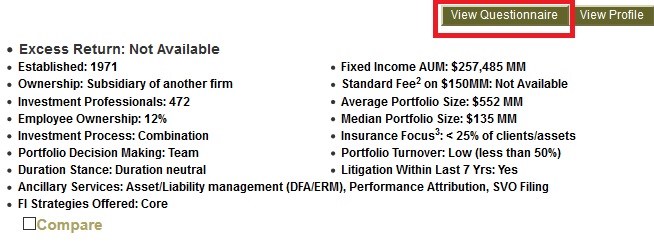
2. The full questionnaire is separated into 6 sections: Background Info., AUM, Historical Record, Administration, Performance and Investment Process.
You can navigate using the "Previous/Next" buttons or click on the section headers to display the corresponding drop-down menu.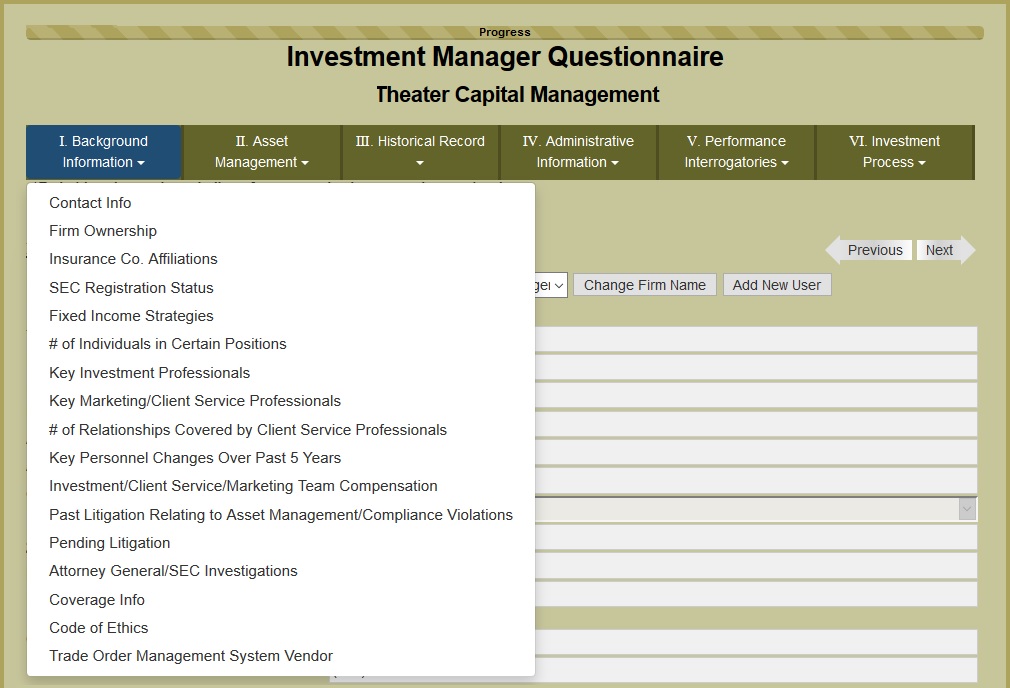
View a Complete Response / Navigate to Specific Question
1. From the initial search view, you can click the header of a specific field to navigate to the corresponding response on the full questionnaire.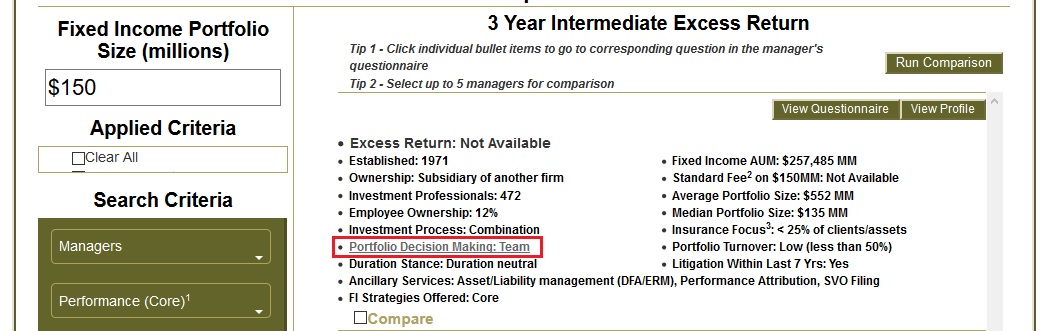
2. From the "Manager Profile," you can view the complete response by clicking on the header of a specific field and navigate to the section of the questionnaire that it corresponds with.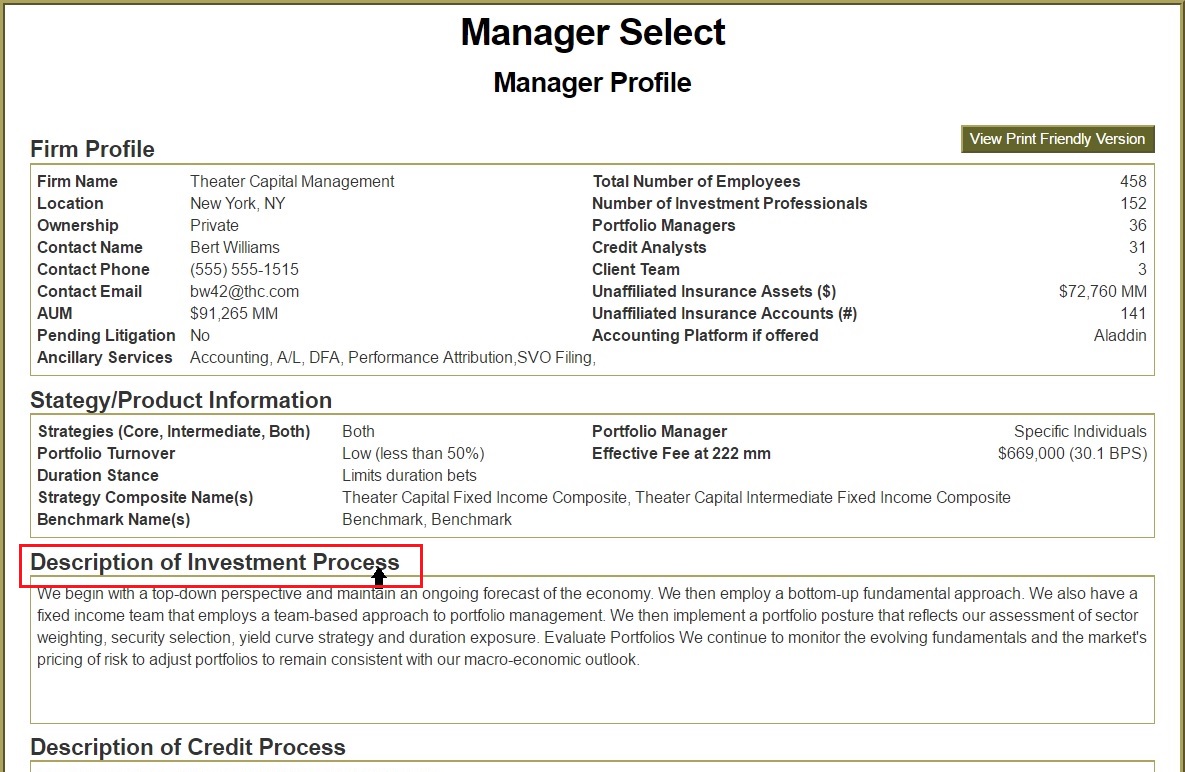
Why Do Certain Values Say, "Not Available" or "NA?"
A performance value equal to “Not Available” indicates the composite data for the selected strategy and period is not readily available. “Not Available” for search result values other than performance indicate the corresponding question in the manager’s questionnaire has not been populated.
How to Run a Comparison Between Firms
1. To run a comparison between managers, check the box found on the bottom of each "Manager Description" section for the managers you would like to include in the analysis.
Up to five managers can be included in a comparison analysis.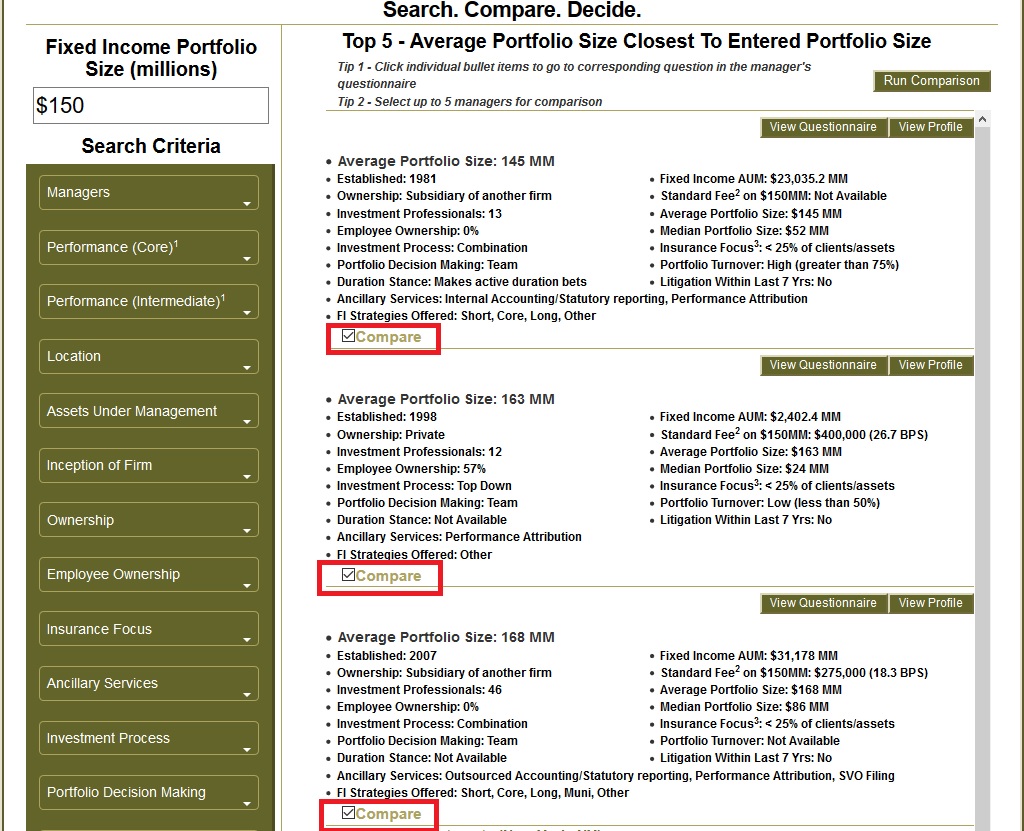
2. Then, click the "Run Comparison" button on the top right-hand corner to generate the analysis.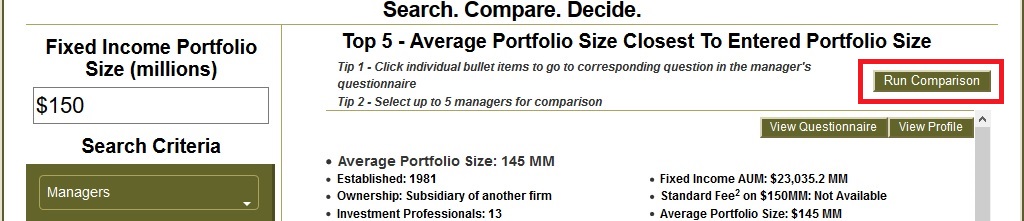
3. The generated analysis will compare both descriptive info. (i.e. investment process, # of clients, ancillary services, etc.) and performance for both Core and Intermediate Composites (if available)
Please Note: “Not Available” indicates the corresponding question in the manager’s questionnaire has not been populated. The presence of “NA” in all fields for a given composite indicates no composite data was readily available for the specified strategy.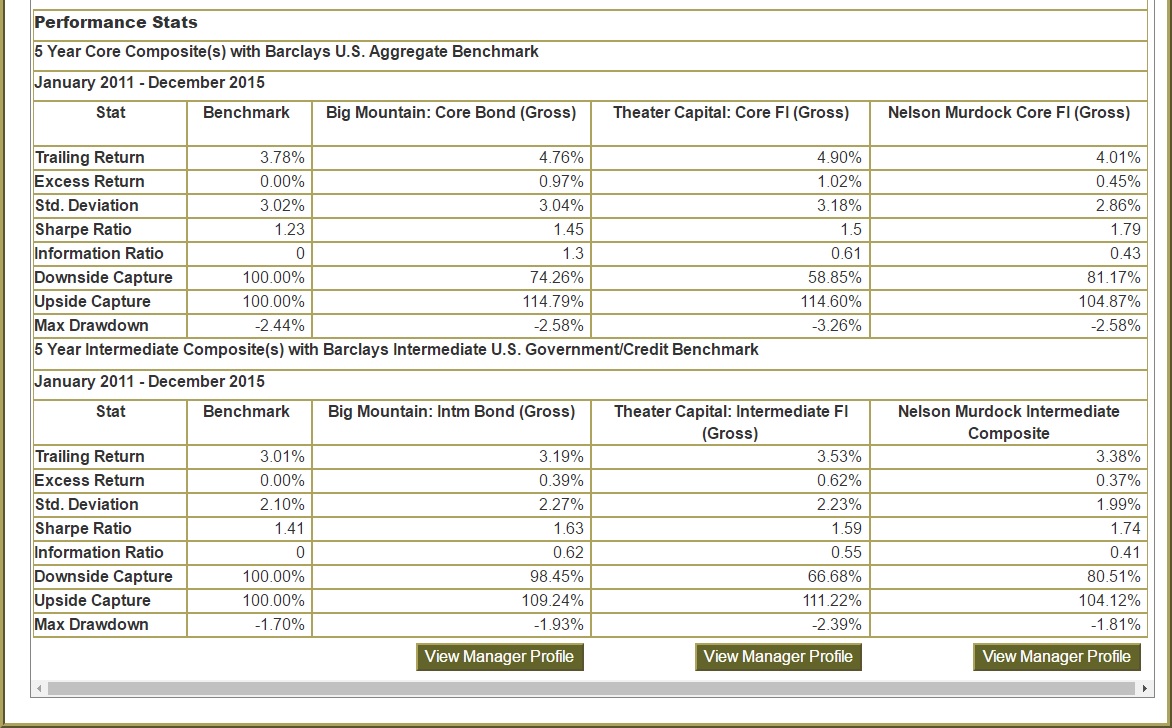
Can I Change the Period Length When Comparing "Performance Stats?"Calculated?
By default, the database will compare manager performance across a 5-year period. To compare performance across 3-Year or 10-Year periods, include a corresponding performance search criteria prior to generating the comparison analysis. 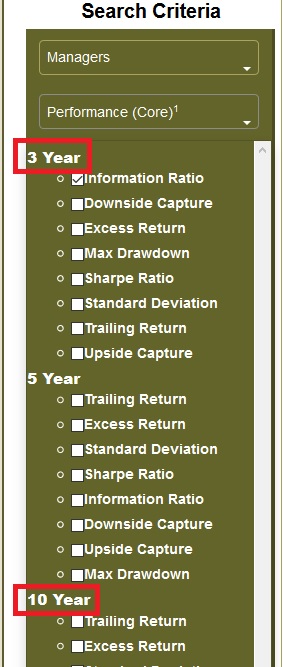
How are "# of Clients" Calculated?
The “# of Clients Comparison” chart uses the sum of the following accounts to calculate the number of unaffiliated insurance clients:
• Unaffiliated Fixed Income AUM General Insurance
• Separate Insurance
• Insurance Company Variable
• Governmental Insurance Risk Pool Accounts
How are "Assets Under Management" Calculated?
The “# of Clients Comparison” chart uses the sum of the following accounts to calculate the number of unaffiliated insurance clients:
• All Affiliated Fixed Income Assets Under Management
• Unaffiliated Fixed Income Assets Under Management
• Governmental Insurance Risk Pool Assets Under Management
Who Can Utilize Manager Select?
Manager Select is Strategic Asset Alliance's propriety database of fixed income investment managers with insurance specialization. SAA uses Manager Select internally whenever its clients are looking to conduct a manager search.
Aside from SAA, InsurerCIO Members that work for an insurance company that is not affiliated with an asset manager in any way are able to access Manager Select (for a limited time).
If you are an insurer looking to access Manager Select, you can become a member and request access here.
How Often Can InsurerCIO Members Access Manager Select?
InsurerCIO Members can access Manager Select for a single 24-Hour Period each quarter.
The 24-Hour Access Period will begin once you have accessed Manager Select. Your complimentary access will then expire 24 hours after you entered the database. i.e. if you enter the database at 4 p.m. on a Tuesday, you can access the database until 4 p.m. on Wednesday.
When the new quarter begins, your 24-Hour access period will automatically reset. These "reset" dates are as follows: January 1st, April 1st, July 1st, October 1st.
Browser Recommendation
We have found a noticeable performance gain when viewing Manager Select in Chrome in comparison to Internet Explorer and/or Firefox.
For any questions or assistance, please contact Eriver Eugenio at eeugenio@saai.com or 360-255-2500 ext. 102.
SAA Solutions
With SAA Solutions, we help insurance companies and governmental risk pools with an investment portfolio <$25MM achieve an improved investment process, at a fraction of the cost of an in-house investment professional.
 Key Benefits of SAA Solutions
- Investment expertise from SAA’s Principals, all former Senior Investment Executives in the insurance industry.
- Similar investment process as utilized by much larger organizations.
- Staff time saved on a very specialized, time intensive activity.
- We have no conflicts of interest nor vested interested in the trades you approve, as you will have access to Index Funds and ETFs from various providers.
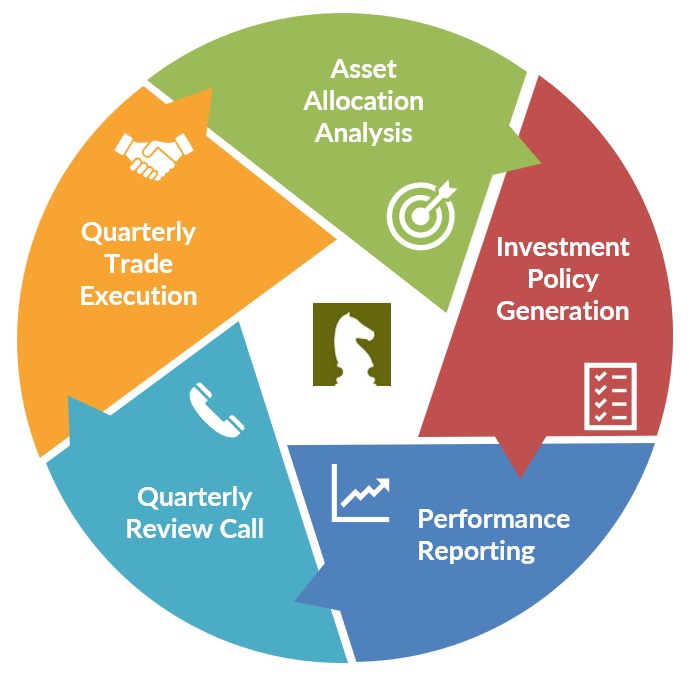
- SAA Solutions provides all of the following:
- Strategic Asset Allocation Analysis
- Investment Policy Generation
- Quarterly Performance Reporting
- Quarterly Review Calls
- Quarterly Trade Execution
What Services Do You Receive?
1. Strategic Asset Allocation Analysis
Advice on the current investment asset allocation and risk profiles, subject to current insurance regulations, every two years or as material business changes occur.
2. Investment Policy Generation
SAA will assist client in developing a policy utilizing SAA’s “Best Practices” templates, including the setting of your company's benchmark (tied to asset allocation).
3. Performance Reporting
Quarterly reporting of investment portfolio, based upon recommended benchmarks.
4. Quarterly Review Call
Review and analysis of your portfolio’s quarterly performance with the Board, Investment Committee and/or senior management via conference call.
5. Quarterly Trade Execution
SAA will assist with quarterly trades via your company's brokerage platform, as necessary, to re-balance portfolio if outside of policy limits.
Helpful Resources
Asset Allocation:
Asset Allocation Primer:
Review how insurers construct their investment portfolios.
View Primer
Fixed Income Primer:
Review the role of investment-grade fixed income in insurance company portfolios.
View Primer
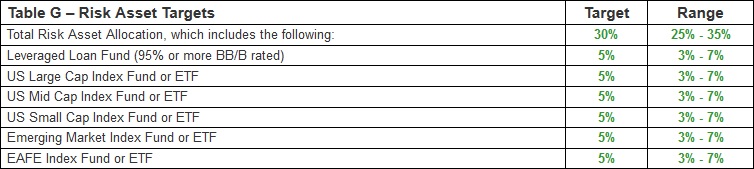
Risk Assets Primer:
Review how insurers/risk pools are utilizing risk assets.
View Primer
Investment Policy Guidelines:
Best Practices:
What are the key components of an investment policy statement?
View Primer
SWOT Analysis:
Common practices and concerns within an insurer or risk pool’s investment policy statement
View Overview
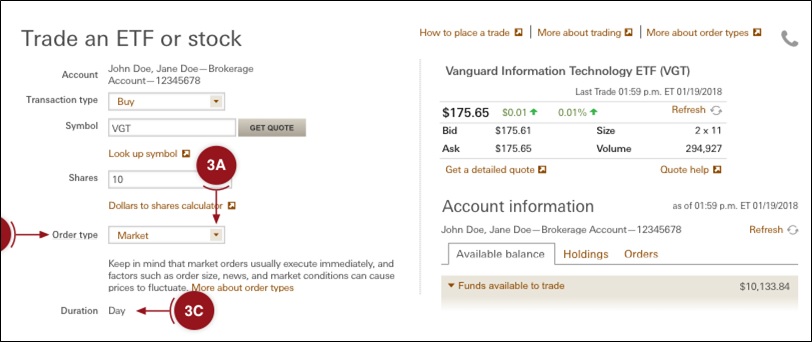
Vanguard Brokerage Platform:
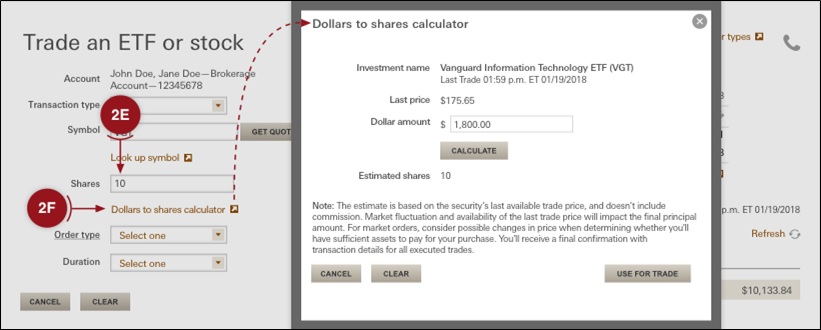
Guide: How To Buy/Sell an ETF:
View Guide
Active vs. Passive Investing:
Insurers and risk pools can utilize either active or passive management for different asset classes.
View Overview
Performance Measurement:
Glossary of Key Terms:
View Glossary
Understanding Key Reports:
To simplify the portfolio review process, insurers and risk pools should focus on better understanding a select group of reports and analyses.
View Overview
Continue to InsurerCIO's Education Library >>
Getting Started:
1. Decide How "Risky" Your Portfolio Is
(Asset Allocation Analysis, Step 1: Risk Appetite)
Investing in “Risk Assets” can provide greater returns, but also greater losses. To begin, review different levels of potential investment loss and select the risk level you are most comfortable with.
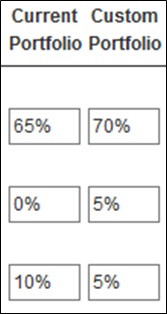
2. Test Different Portfolio Combinations
(Asset Allocation Analysis, Step 2: Asset Allocation)
Adjust what you are investing in and see how your portfolio’s performance might change.
3. Update Your Investment Policy
(Investment Policy Generation)
An Investment Policy outlines the goals and structure of your investment portfolio, as well as the parties involved in your investment process. After selecting the preferred portfolio allocation, updated the investment policy to reflect these changes.
4. Talk to an SAA Principal
(Quarterly Review Call)
SAA’s Principals will answer any initial questions you have about your changes you are thinking of making to your portfolio. After setting your asset allocation, SAA’s Principals will assist in setting up your Vanguard Brokerage Platform.
5. Setup Your Portfolio on Vanguard’s Brokerage Platform
(Quarterly Trade Execution)
SAA will help you make the proper trades to implement your desired investment portfolio. SAA will also recommend trades to help your portfolio maintain its structure.
6. Keep Tabs on Your Portfolio
(Quarterly Performance Reporting / Review Call)
Every quarter, SAA will provide a summary of how your portfolio has been performing through reports and conference calls. We will answer any questions you may have about your portfolio.
1. Asset Allocation
SAA will provide advice on the current investment asset allocation and risk profiles, subject to current insurance regulations, every two years or as material business changes occur.
Over 90% of your company’s investment performance and returns will be determined by the allocation decision.
SAA will review the impact of different allocations in a risk management framework by modeling various asset class combinations for clients.
SAA uses an asset allocation approach providing detailed asset allocation strategies designed to maximize return on risk adjusted capital for any given product line.
*The information provided is meant for demonstrative purposes only. The information does not reflect or represent an actual company or entity.
Strategic Asset Allocation - Efficient Frontier:
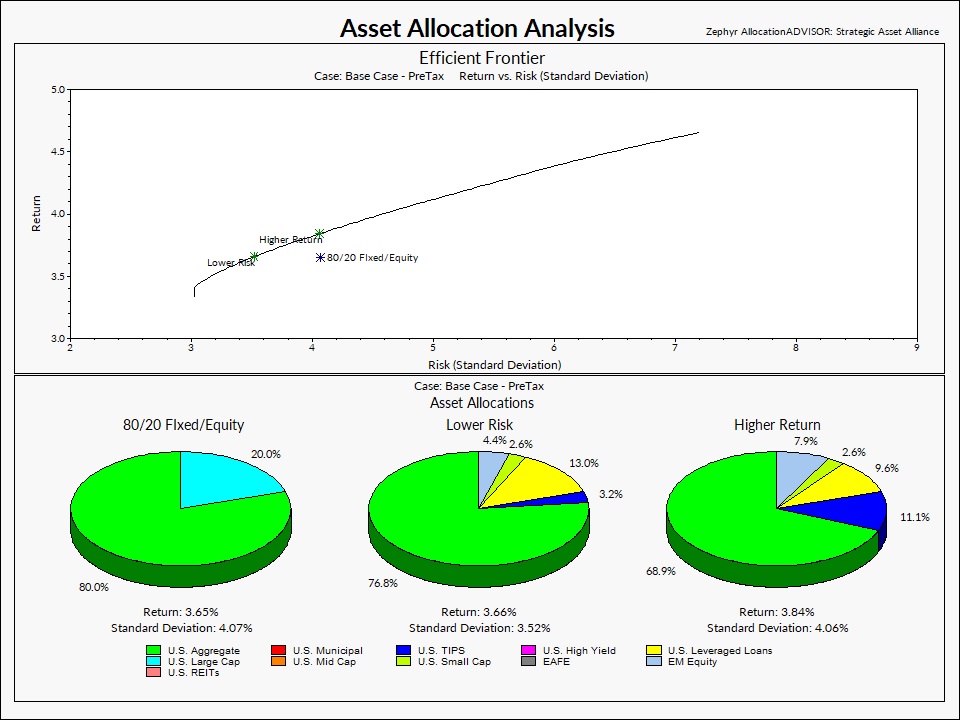
*Provided for illustrative purposes only, not a recommendation.
SAA integrates the results of efficient frontier analysis with the impact of company constraints, downside risk analysis and other variables, to develop a plan that will best achieve each client’s objectives.
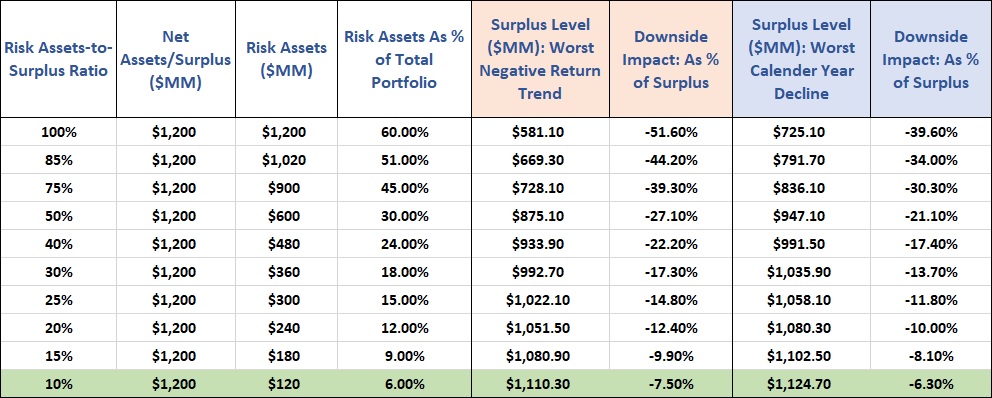
Strategic Asset Allocation - Risk Asset Impact to Surplus:
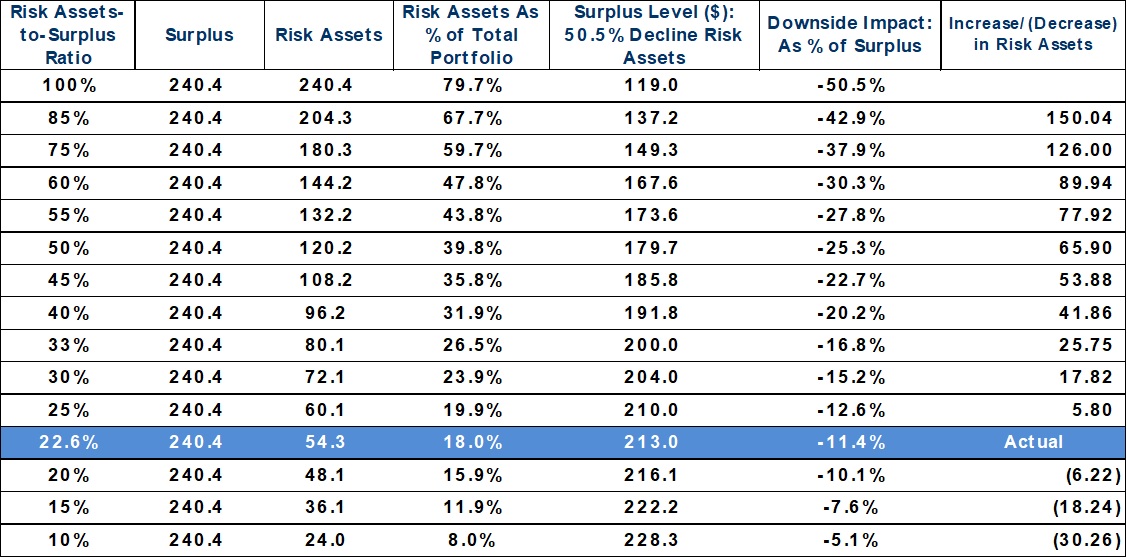
*Provided for illustrative purposes only, not a recommendation.
The impact of risk asset declines on company surplus levels is a key component of SAA’s strategic asset allocation analysis given the implications these declines may have on a company’s ability to continue to operate as desired.
3. Performance Reporting
Quarterly reporting of investment portfolio holdings and risks, based upon recommended benchmarks.
Quarerly Reports Consist Of:
- Market Update and Commentary
- Return Summary for All Funds
- Analytical Reporting Review
- Asset Allocation vs. Targets
- Risk Asset Exposure Relative to Company Surplus
Performance Summary - Example:
InsurerCIO's Portfolio Analytics:
To help streamline the performance measurement process, SAA Solutions integrates elements of InsurerCIO's analytical platform to generate additional in-depth reports. For SAA Solutions clients, these analyses would be of most importance:
What Does this Show About Your Portfolio:
The table shows performance against the relevant benchmark for various fixed income portfolios and equity portfolios. Fixed income portfolios, in the example, are also shown combined. Then, the fixed income and equity portfolios’ performances are combined for a ‘Total Consolidated’ viewpoint. We also use red and green arrows to note over/under performance. Since over or under performance in a relatively small portfolio may not greatly impact the overall portfolio, we show the ending market value for each fixed and equity portfolio, as well as the percentage invested in each.
What Does this Show About Your Portfolio:
How bad did the portfolio’s value get as compared to its benchmark? Drawdown starts to appear on this graph once value turns downward. It stays down until portfolio value recovers, but starts again once the value turns down. These ‘icicles’ show how deep the drawdown was and for how long (width of the ‘icicle’) as well as when they occurred. Although this graph is for the fixed income portfolio, this can also be applied to other portfolios, including equities, where value changes make drawdown even more important to view.
What It Shows:
Fixed income portfolio asset allocation by sector over the last six years. This chart can be viewed in either a detailed or summarized version.
Significance:
Insurers tend to make changes to their portfolio slowly from quarter to quarter, keeping in mind realized gain or loss limits, etc. However this report allows you to see trends over a longer term horizon, since small changes over a long period of time can equate to very large changes.
What Does this Show About Your Portfolio:
This chart reflects the expected annualized return of your company's risk asset portfolio and the potential downside impact to surplus, adjusted for deferred federal income taxes, from market movements in risk assets*. Surplus growth and declines are primarily driven by the return and volatility characteristics in risk assets.
This broadly reflects your company's risk asset appetite, implied by your asset allocation. Are you comfortable with the potential shock to your surplus given a 2-standard deviation (95th percentile) volatility event? If your surplus looks mostly unaffected by a 2 STD risk asset event, should you consider adding risk asset exposure in order to gain additional return?
4. Quarterly Review Call
Once per quarter, SAA's Principals will provide a review and analysis of your portfolio’s quarterly performance via conference call.
How are we doing? How can we do better? Where are the potential problems?
SAA will provide answers to these questions and help improve your insurer or pool's Board members, executives and staff better understand the investment process.
About SAA:
- All Principals are Former Senior Investment Executives at Insurance Companies
- We Have Worked with Pooling Organizations for 15+ Years
- We Only Work with Insurers and Governmental Risk Pools
- Since Inception (1994) SAA Has Worked With More Than 100 Insurers/Pools
Meet SAA's Principals:

Alton R. Cogert, CFA, CPA, CAIA, CGMA, President and Chief Executive Officer. Mr. Cogert formed Strategic Asset Alliance in 1994.
He has served as a technical advisor to the NAIC Invested Assets Working Group. He is a former member of the Board of Directors and former chairman of the Investment Committee of the National Alliance of Life Companies.
He is a Chartered Financial Analyst, a Certified Public Accountant and a Chartered Alternative Investment Analyst. Mr. Cogert holds a BS from the Wharton School of the University of Pennsylvania and an MBA from the University of Southern California.
Email: acogert@saai.com
Phone: (360) 255-2500

Daniel G. Smereck, Managing Director, is the primary consultant for SAA’s governmental risk pooling clients. Mr. Smereck has over 20 years of experience across investments, insurance, corporate finance, statistical analysis, and information technology.
Prior to joining SAA in 2003, Mr. Smereck was Senior Vice President and Chief Investment/Information Officer for a large, regional medical malpractice insurer where he was responsible for treasury, asset management and information technology.
Mr. Smereck has a BS in Managerial Finance, an MBA from the University of Nevada, Las Vegas, and an MS in Finance from the Carroll School of Management, Boston College.
Email: dsmereck@saai.com
Phone: (360) 255-2500 ext. 106
2023 © SAA Advisors, Inc d/b/a Strategic Asset Alliance
This website uses cookies to store information on your computer. Some of these cookies are used for visitor analysis, others may be necessary for the website to function properly. You should configure your browser to only accept the cookies you wish to approve, or leave this website.