Peer companies are selected based upon them having similar sized portfolios and writing similar lines of business as defined by their annual statements. At your request, we will also perform similar analysis using data from other companies selected by you.
SAA's Peer Group Analysis is provided to all SAA Partner Clients and SAA Members (if applicable)
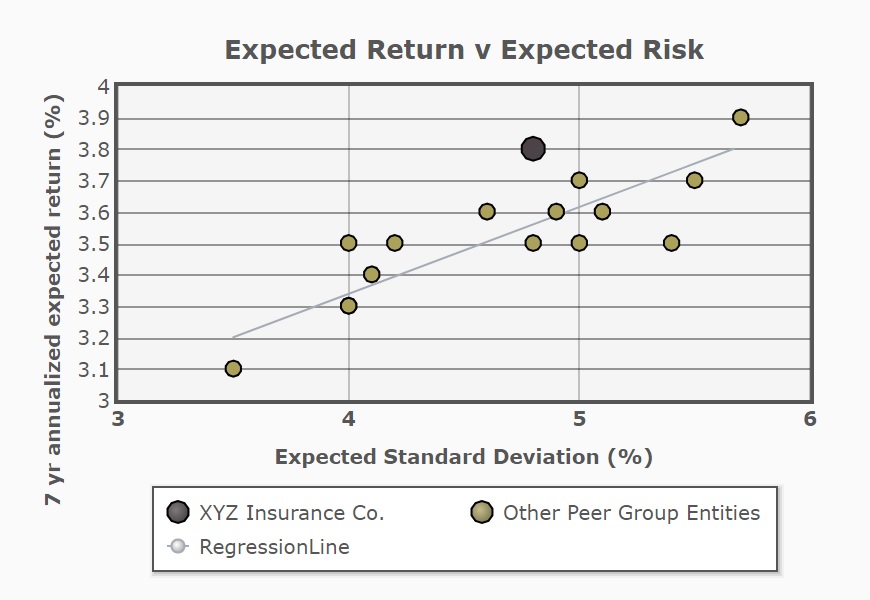
What Does this Show About Your Portfolio:
This chart broadly indicates your company's expected return to your portfolio standard deviation relative to your peers. Expected return is not a guaranteed rate of return, but rather, a forecast of the future value of the portfolio. The standard deviation reflects your portfolio's expected volatility.
Investment opportunities should always be made in conjunction with their risk characteristics. Portfolio risk can be reduced by holding combinations of assets that are diversified and less correlated.
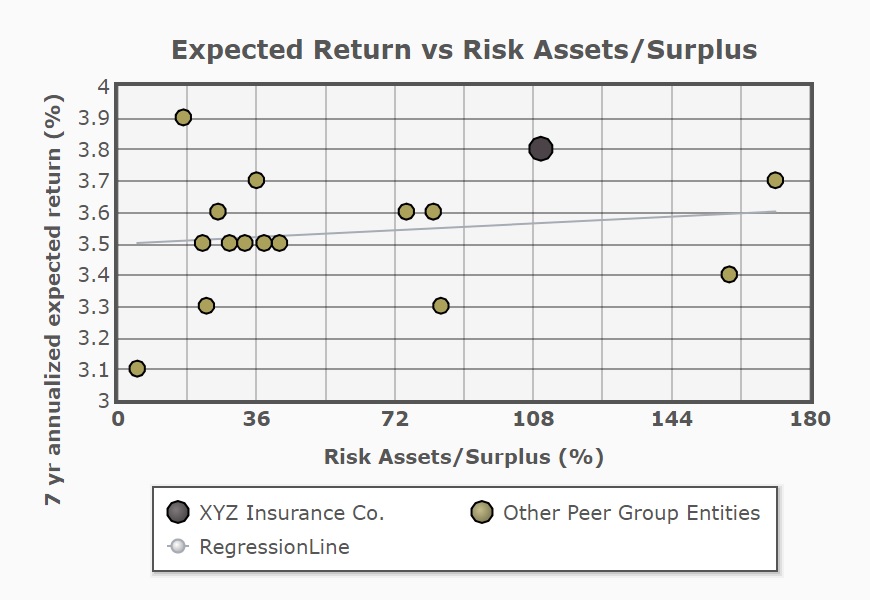
What Does this Show About Your Portfolio:
This chart indicates your company's "expected return" relative to your "risk assets". Additionally, you can compare your company's expected return to your peers.
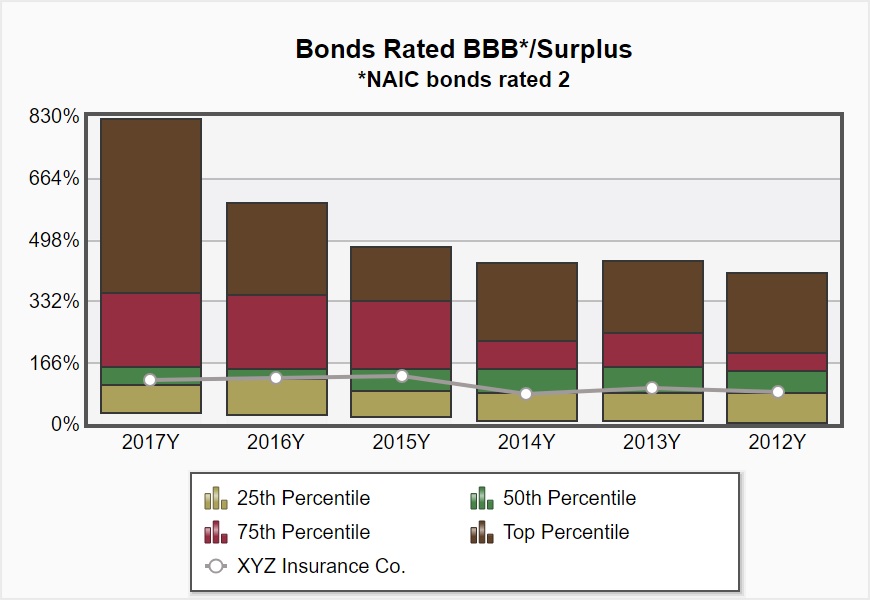
What Does this Show About Your Portfolio:
This chart indicates your company's fixed income exposure to BBB rated bonds relative to your peers.
Companies tend to increase BBB allocations when seeking greater investment income or future returns.
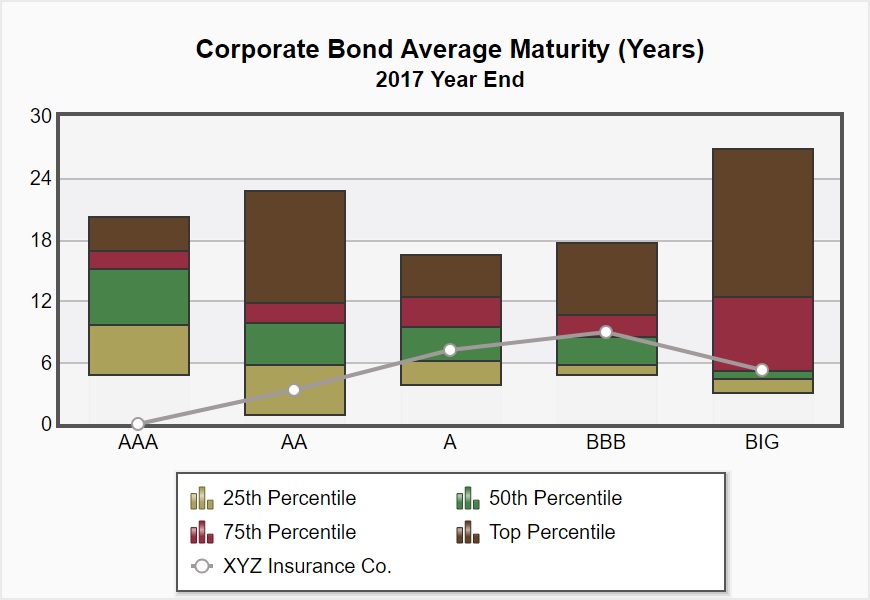
What Does this Show About Your Portfolio:
This chart displays what your company's average maturity is for each credit rating bucket relative to your peers within your corporate bond allocation.
This is a measurement in years for how long it takes for the price of a bond to be repaid by its internal cash flows (coupons and principal repayment at maturity). Bonds with higher maturities carry more interest rate risk and have higher price volatility. Combining more interest rate risk with a lower credit profile could also be a concern.
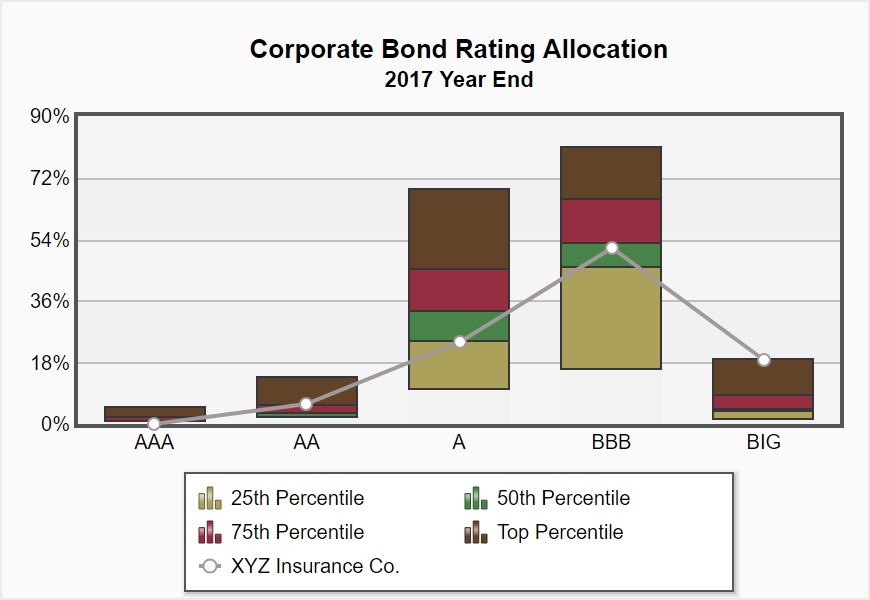
What Does this Show About Your Portfolio:
This chart indicates your company's allocation to corporate bonds broken down by credit rating category relative to your peers.
Corporate bonds are typically higher risk than government bonds which typically leads to higher yields. The lower an issuer's credit quality, the more costly it becomes to issue debt due to its increased chances of default.
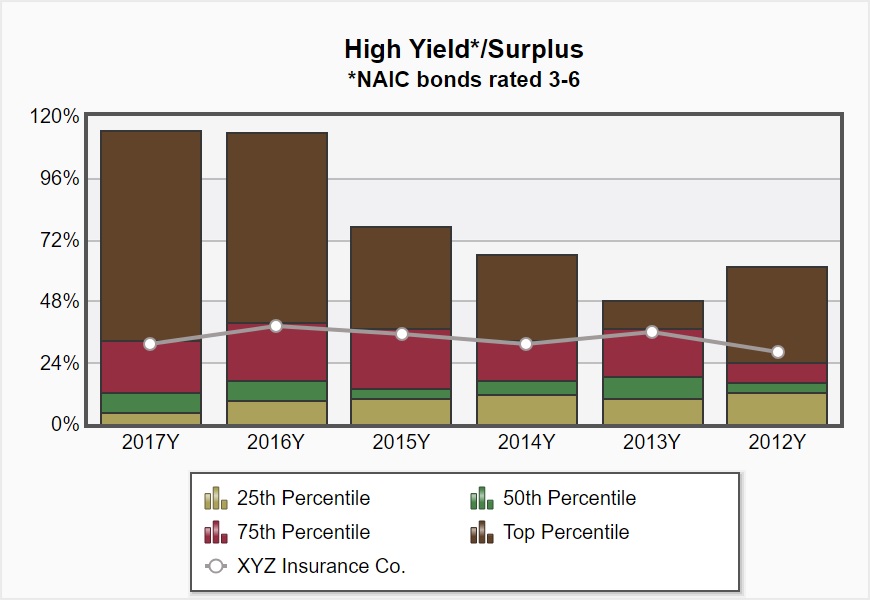
What Does this Show About Your Portfolio:
This chart indicates your company's allocation to NAIC rated bonds 3 to 6 relative to your peers.
High Yield bonds carry a higher risk of default; however, these bonds pay a higher yield than investment grade bonds.
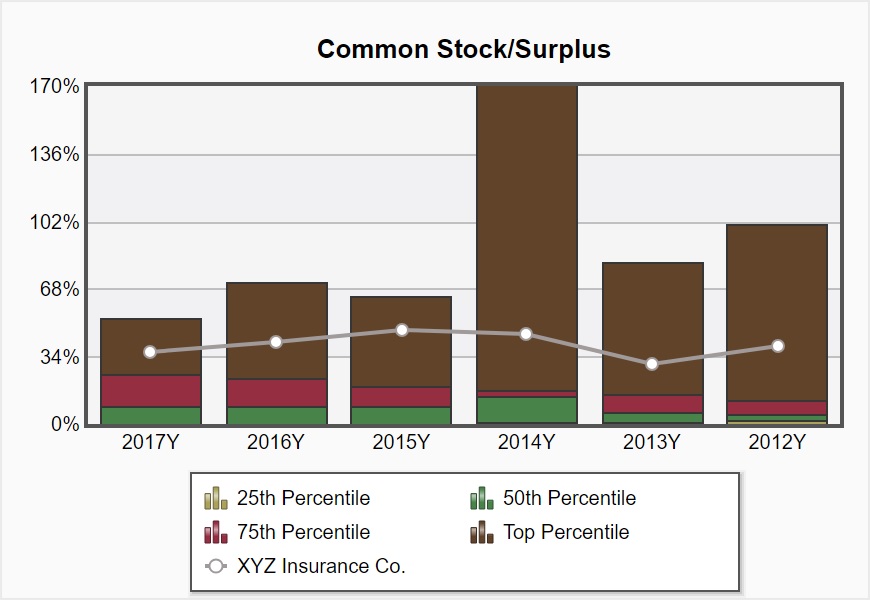
What Does this Show About Your Portfolio:
This chart indicates your company's common stock allocation relative to your peers.
Common stocks typically offer greater returns than bonds but carry higher risk of loss as well as increased return volatility. If your portfolio holds a large percentage of surplus in common stocks and stocks suffer significant losses (e.g. 2008), your surplus position could be materially impacted.
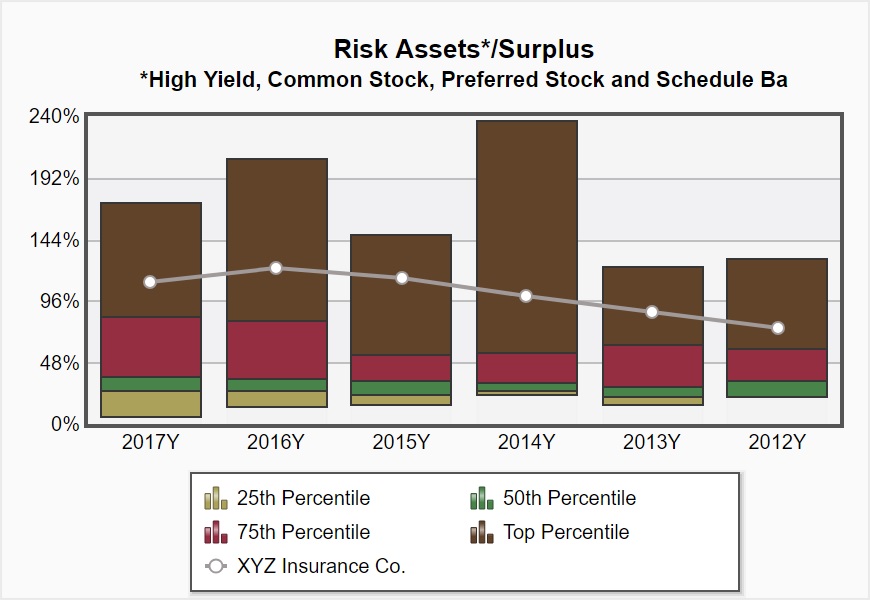
What Does this Show About Your Portfolio:
This chart broadly indicates your company"s allocation to "risk assets" relative to your peers. Risk assets typically consist of High Yield bonds, Common Stock, Preferred Stock, and long-term Schedule Ba investments which may include a number of other asset classes (real estate, hedge funds etc.).
Since returns are not guaranteed, an increase in your risk asset bucket over time should be yielding you an appropriate increase in return. If your company is in a lower quartile, it is important to consider if any added benefits could be gained from your portfolio adjusted for risk.